Assessment for soil nutrient content prediction model based on visible-near infrared spectroscopy in the typical regions of Guangdong Province
-
摘要:目的
可见−近红外光谱(Visible-near infrared spectroscopy,VNIRS)可以利用少量土壤样品建立预测模型,从而无损快速地预测土壤养分含量。然而,至今鲜见广东省土壤养分的VNIRS预测模型的报道。本研究旨在通过传统化学分析方法和VNIRS技术对广东典型地区的耕地土壤进行分析,构建土壤全量及速效养分含量的VNIRS预测模型,并评估利用光谱分析土壤全量和速效养分含量的可行性,为广东省土壤养分的快速检测及质量评估提供科学参考。
方法本研究采集了粤东(梅州)、粤西(湛江)、粤北(韶关)、粤西北(肇庆)和珠三角(惠州和珠海) 5个地区共514份耕地土壤样品,测量样品有机质、全氮、可溶性有机碳、碱解氮和速效磷含量,同时利用VNIRS在400~2490 nm波长范围内探明其全光谱特征,筛选定标样品,结合偏最小二乘法和主成分分析,建立预测模型,并在此基础上进行反向验证,评估模型的可行性。
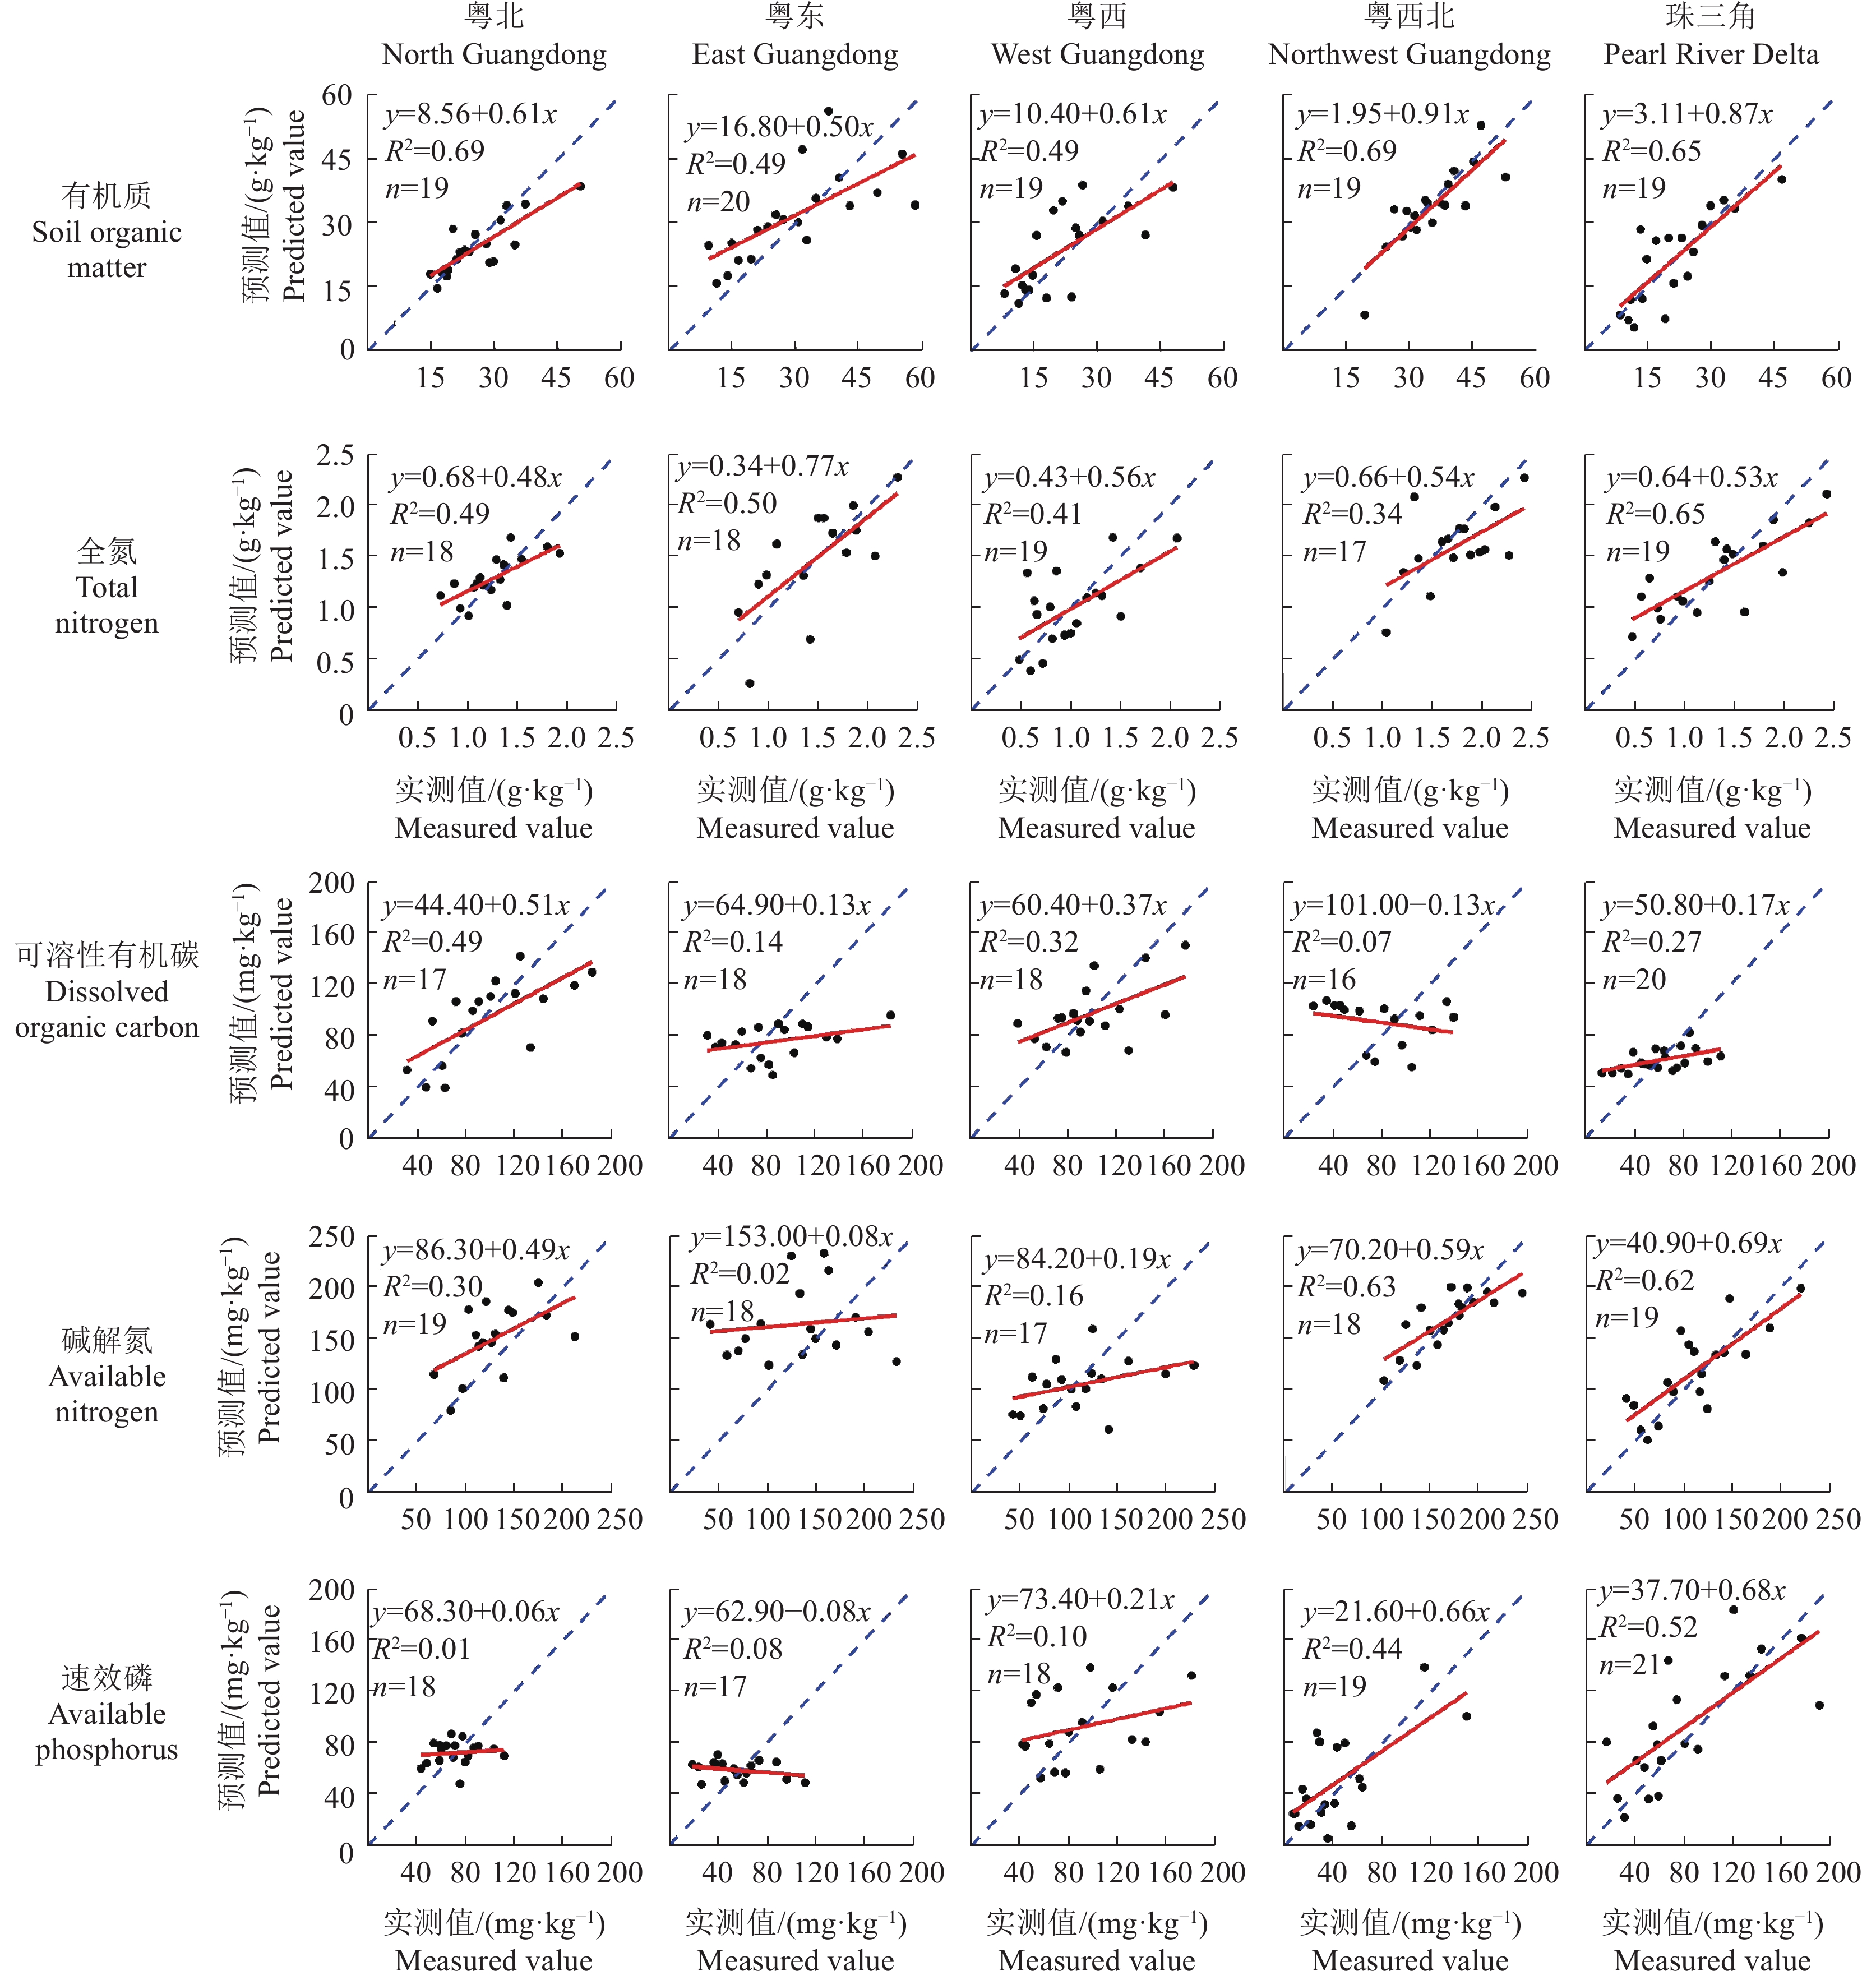
结果各地区土壤有机质、全氮、可溶性有机碳、碱解氮和速效磷含量及光谱特征均存在显著差异。有机质和全氮的定标预测模型效果较好,其中,粤西北地区的有机质定标相关系数达到0.831 1,珠三角地区的全氮定标相关系数达到0.789 8;可溶性有机碳、碱解氮和速效磷的预测模型效果在地区间差异较大,粤西北和珠三角地区碱解氮和速效磷的定标效果远优于其他地区。反向验证结果表明,有机质和全氮的预测值与实测值具有较好的相关性,决定系数(R2)最高分别达到0.69和0.65;粤西北和珠三角地区碱解氮的反向验证结果也较好,R2达到0.63和0.62;而可溶性有机碳和速效磷的反向验证结果总体较差。
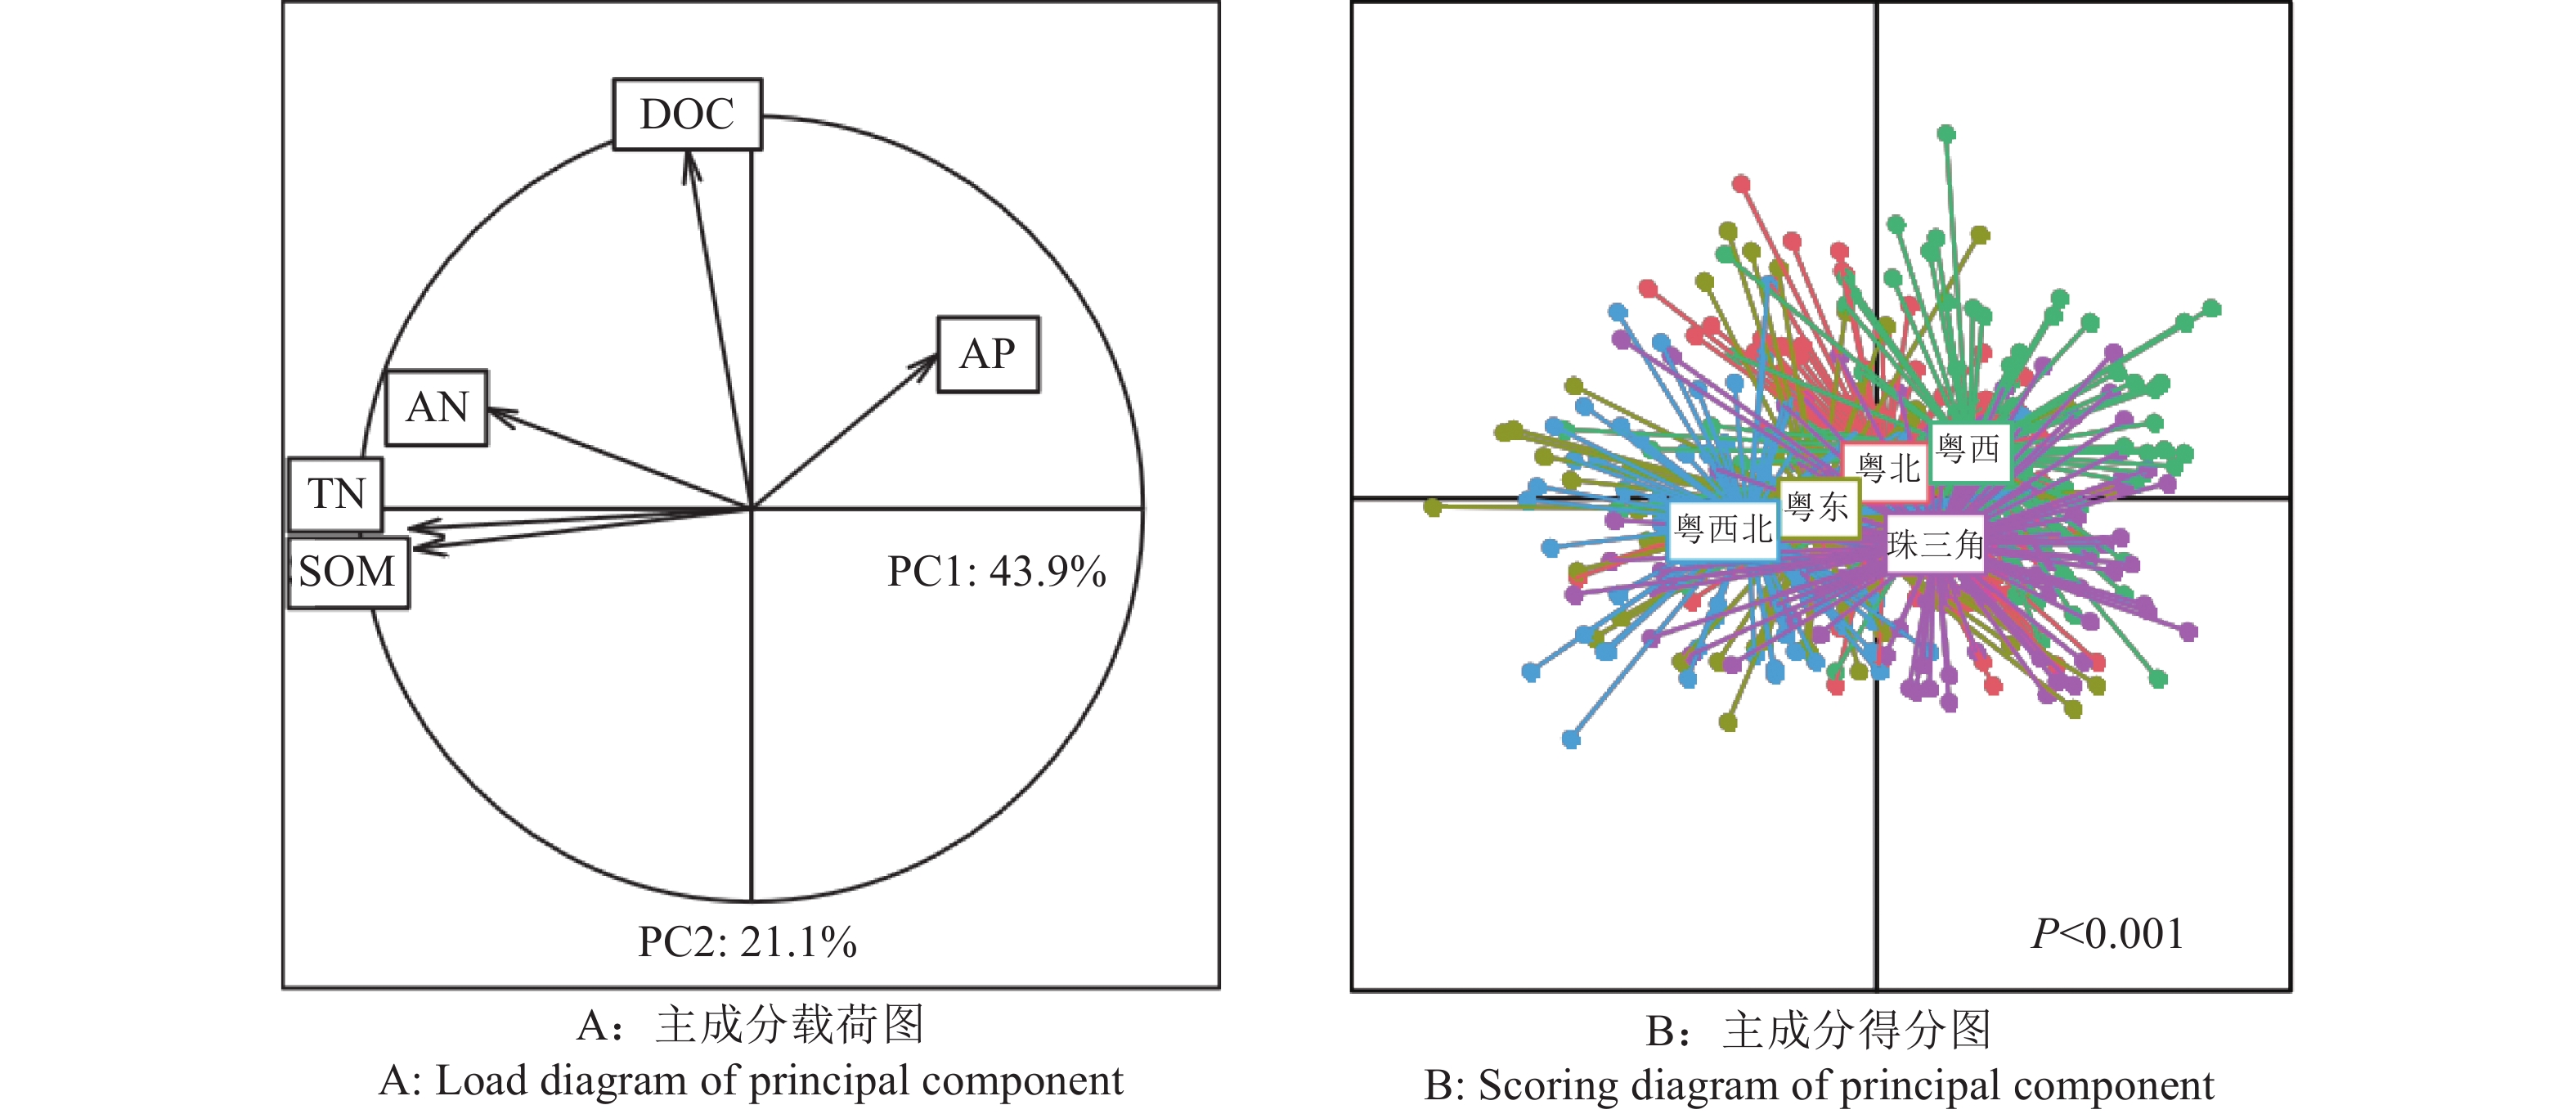
结论VNIRS技术能够区分省域内不同地区的土壤来源,可以作为未来土壤分类和土壤质量调查的重要评价指标。VNIRS技术能够较好地直接预测耕地土壤有机质和全氮含量,对可溶性有机碳、碱解氮、速效磷含量的预测存在明显元素差别和地区差异,今后需进一步筛选光谱范围或采用更优方式构建模型。
Abstract:ObjectiveVisible-near-infrared spectroscopy (VNIRS) can non-invasively and rapidly predict soil nutrient contents based on models developed using data of some representative soil samples, but soil nutrient content prediction models for different regions of Guangdong Province are still lacking. In this study, representative agricultural soil samples were collected from Guangdong Province, and models were developed based on the traditional soil chemical analyses and VNIRS spectral signatures. The objective was to assess the predictive ability of the models for soil total and available nutrients so as to provide a scientific basis for rapid soil nutrient content estimation and soil quality evaluation in Guangdong Province.
MethodA total of 514 representative soil samples were collected from the east (Meizhou), west (Zhanjiang), north (Shaoguan), and northwest regions (Zhaoqing) and the Pearl River Delta (Huizhou and Zhuhai) in Guangdong Province, and the contents of soil organic matter, total nitrogen, dissolved organic carbon, available nitrogen, and available phosphorus were analyzed. In addition, the VNIRS spectral signatures of soil samples were obtained between 400 and 2 490 nm. Models were developed and calibrated using partial least squares regression combined with principal component analysis, and the models were reversely validated and assessed for their predictive abilities.
ResultThere were significant differences in the contents of soil organic matter, total nitrogen, dissolved organic carbon, available nitrogen and available phosphorus and VNIRS spectral signatures among the soils from different regions. The models for soil organic matter and total nitrogen showed good prediction performances, with validation determination coefficients of 0.831 1 for soil organic matter in the northwest region and 0.789 8 for total nitrogen in the Pearl River Delta. The models for dissolved organic carbon, available nitrogen, and available phosphorus showed very different prediction performances among regions, with much better performances for available nitrogen and available phosphorus in the northwest region and Pearl River Delta compared with other regions. Model validation showed good correlations between the predicted and measured values of soil organic matter and total nitrogen, with the highest coefficients of determination (R2) being up to 0.69 and 0.65, respectively. The predicted and measured values of available nitrogen in the northwest region and Pearl River Delta also showed good correlations, with R2 of 0.63 and 0.62, respectively. However, model validation showed generally poor correlations between the predicted and measured values of dissolved organic carbon and available phosphorus.
ConclusionVNIRS technology can predict soil organic matter and nutrient contents to differentiate soils from different regions at the provincial scale. Soil VNIRS spectral signature can be used as an important index for soil classification and soil quality evaluation. VNIRS technology shows good performance in the predictions of soil organic matter and total nitrogen contents, but its performance in the predictions of dissolved organic carbon, available nitrogen, and available phosphorus contents is element- and region-dependent. Therefore, future efforts should be focused on spectral range selection and model optimization.
-
-
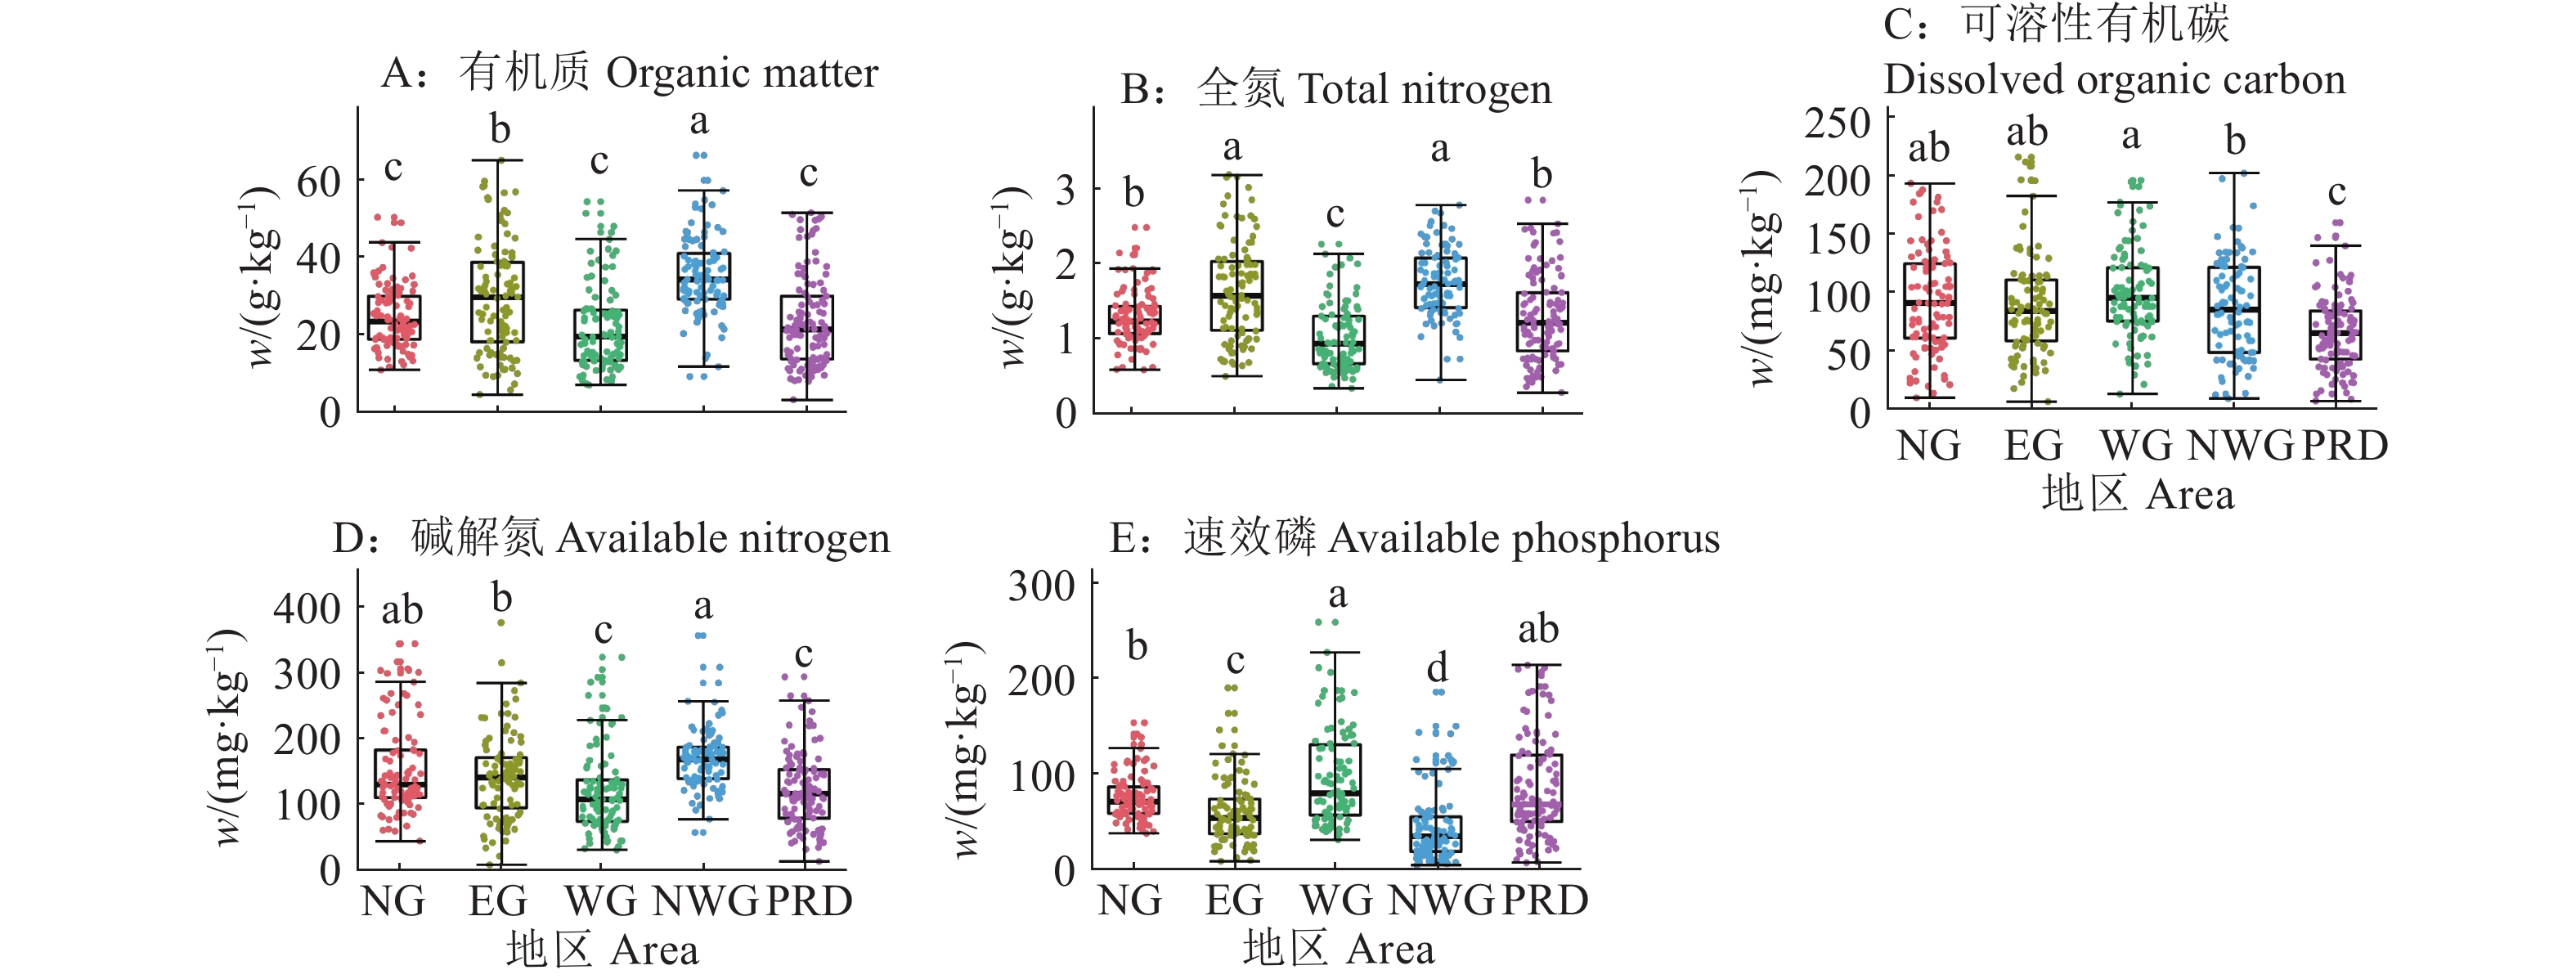
图 1 广东省不同地区土壤养分含量的差异
NG:粤北,EG:粤东,WG:粵西,NWG:粤西北,PRD:珠三角;各小图中不同小写字母表示不同地区间差异显著(P < 0.05,Duncan’s法)
Figure 1. Differences of soil nutrient contents in different areas of Guangdong Province
NG: North Guangdong, EG: East Guangdong, WG: West Guangdong, NWG: Northwest Guangdong, PRD: Pearl River Delta; Different lowercase letters in each figure indicate significant differences among different areas (P < 0.05, Duncan’s method)
表 1 采样区概况
Table 1 Information about sampling pots
地区
Region行政市
Administrative city样点数量
Sampling point number气候类型
Climate type土壤类型
Soil type粤北
North Guangdong韶关 100 亚热带季风气候 以红壤为主,风化程度深,富铁铝化作用明显,质地较黏重 粤东
East Guangdong梅州 102 亚热带季风气候 以赤红壤、黄壤为主 粤西
West Guangdong湛江 98 热带北缘季风气候 有赤红壤、砖红壤,土层深厚,质地黏重,呈强酸性反应,铁铝富集最为显著 粤西北
Northwest Guangdong肇庆 99 南亚热带季风气候 以赤红壤为主,农田土壤整体偏酸 珠三角
Pearl River Delta惠州 65 亚热带季风气候 有红壤、赤红壤和黄壤,以赤红壤类型分布最广,土壤呈酸性,阳离子交换量较低,矿质养分较贫乏 珠海 50 亚热带季风海洋性
气候有红壤和赤红壤,红壤面积较少,分布不广,300 m以上的丘陵台地多分布有红壤 表 2 广东省各地区的土壤养分模型预测效果1)
Table 2 Prediction performance of soil nutrient models in different areas of Guangdong Province
指标
Index地区
AreaSEC RSQ SECV 1-VR 有机质
Soil organic matter粤北 4.260 2 0.662 2 5.666 3 0.406 5 粤东 10.191 2 0.476 4 11.699 5 0.337 7 粤西 3.803 4 0.837 8 7.071 8 0.595 1 粤西北 3.985 1 0.831 1 5.032 2 0.735 8 珠三角 5.057 6 0.817 2 6.123 1 0.729 5 全氮
Total nitrogen粤北 0.107 4 0.898 6 0.180 9 0.731 9 粤东 0.295 9 0.784 0 0.382 5 0.646 6 粤西 0.219 8 0.660 5 0.347 6 0.336 7 粤西北 0.245 3 0.704 7 0.310 4 0.540 2 珠三角 0.245 4 0.789 8 0.308 9 0.677 0 可溶性有机碳
Dissolved organic carbon粤北 24.437 4 0.694 1 26.896 4 0.641 1 粤东 31.206 8 0.141 4 34.763 2 0.043 9 粤西 25.987 2 0.471 5 30.433 7 0.324 5 粤西北 31.937 4 0.281 6 33.930 4 0.216 6 珠三角 27.896 4 0.132 6 30.310 7 −0.021 7 碱解氮
Available nitrogen粤北 61.912 7 0.108 7 72.340 4 −0.040 3 粤东 50.192 4 0.323 6 57.612 0 0.148 8 粤西 42.216 6 0.380 4 53.081 4 0.130 4 粤西北 19.314 8 0.731 4 25.338 4 0.536 7 珠三角 20.557 2 0.820 0 27.365 0 0.685 0 速效磷
Available phosphorus粤北 15.325 8 0.225 1 18.882 4 0.077 8 粤东 24.353 7 0.070 1 27.115 0 −0.040 5 粤西 31.471 9 0.482 7 34.417 0 0.374 3 粤西北 18.240 2 0.647 6 28.404 3 0.400 4 珠三角 28.844 6 0.694 9 35.797 0 0.546 2 1) SEC:定标标准误差;RSQ:定标相关系数;SECV:交互验证标准误差;1-VR:交叉验证相关系数
1) SEC: Standard error of calibration; RSQ: Coefficient of determination for validation; SECV: Standard error of cross validation; 1-VR: 1 minus the variance ration -
[1] 赵其国, 孙波, 张桃林. 土壤质量与持续环境Ⅰ: 土壤质量的定义及评价方法[J]. 土壤, 1997(3): 113-120. [2] 张甘霖, 朱永官, 傅伯杰. 城市土壤质量演变及其生态环境效应[J]. 生态学报, 2003, 23(3): 539-546. [3] XIAO R, SU S, ZHANG Z, et al. Dynamics of soil sealing and soil landscape patterns under rapid urbanization[J]. Catena, 2013, 109: 1-12. doi: 10.1016/j.catena.2013.05.004
[4] 江恩赐, 陈林, 颜继忠, 等. 智能高光谱成像融合CARS特征波段筛选快速检测硫熏牛膝SO2含量[J]. 中国中药杂志, 2022, 47(7): 1864-1870. [5] 王巧华, 马逸霄, 付丹丹. 基于光谱技术的禽蛋内部品质无损检测研究进展[J]. 华中农业大学学报, 2021, 40(6): 220-230. [6] 宋亮, 刘善军, 虞茉莉, 等. 基于可见−近红外和热红外光谱联合分析的煤和矸石分类方法研究[J]. 光谱学与光谱分析, 2017, 37(2): 416-422. [7] BADARÓ A T, MORIMITSU F L, FERREIRA A R, et al. Identification of fiber added to semolina by near infrared (NIR) spectral techniques[J]. Food Chemistry, 2019, 289: 195-203. doi: 10.1016/j.foodchem.2019.03.057
[8] 孙园园, 蔡怡聪, 谢黎虹, 等. 近红外光谱分析技术在稻米品质测定和遗传分析中应用研究概述[J]. 中国稻米, 2016, 22(6): 1-3. [9] MENDES DE OLIVEIRA D, FONTES L M, PASQUINI C. Comparing laser induced breakdown spectroscopy, near infrared spectroscopy, and their integration for simultaneous multi-elemental determination of micro-and macronutrients in vegetable samples[J]. Analytica Chimica Acta, 2019, 1062: 28-36. doi: 10.1016/j.aca.2019.02.043
[10] ELLE O, RICHTER R, VOHLAND M, et al. Fine root lignin content is well predictable with near-infrared spectroscopy[J]. Scientific Reports, 2019, 9: 6396. doi: 10.1038/s41598-018-37186-2
[11] BELLON-MAUREL V, MCBRATNEY A. Near-infrared (NIR) and mid-infrared (MIR) spectroscopic techniques for assessing the amount of carbon stock in soils: Critical review and research perspectives[J]. Soil Biology and Biochemistry, 2011, 43(7): 1398-1410. doi: 10.1016/j.soilbio.2011.02.019
[12] 刘燕德, 熊松盛, 刘德力. 近红外光谱技术在土壤成分检测中的研究进展[J]. 光谱学与光谱分析, 2014, 34(10): 2639-2644. [13] VELASQUEZ E, LAVELLE P, BARRIOS E, et al. Evaluating soil quality in tropical agroecosystems of Colombia using NIRS[J]. Soil Biology and Biochemistry, 2005, 37(5): 889-898. doi: 10.1016/j.soilbio.2004.09.009
[14] DE SANTANA F B, DE SOUZA A M, POPPI R J. Visible and near infrared spectroscopy coupled to random forest to quantify some soil quality parameters[J]. Spectrochimica Acta Part A: Molecular and Biomolecular Spectroscopy, 2018, 191: 454-462. doi: 10.1016/j.saa.2017.10.052
[15] JOUQUET P, HENRY-DES-TUREAUX T, MATHIEU J, et al. Utilization of near infrared reflectance spectroscopy (NIRS) to quantify the impact of earthworms on soil and carbon erosion in steep slope ecosystem: A study case in Northern Vietnam[J]. Catena, 2010, 81(2): 113-116. doi: 10.1016/j.catena.2010.01.010
[16] 张欣跃, 赵玉国, 刘峰, 等. 基于可见−近红外光谱与化学属性的土壤来源地判别[J]. 土壤学报, 2019, 56(5): 1060-1071. [17] MOUAZEN A M, KUANG B, DE BAERDEMAEKER J, et al. Comparison among principal component, partial least squares and back propagation neural network analyses for accuracy of measurement of selected soil properties with visible and near infrared spectroscopy[J]. Geoderma, 2010, 158(1/2): 23-31. doi: 10.1016/j.geoderma.2010.03.001
[18] 李伟, 张书慧, 张倩, 等. 近红外光谱法快速测定土壤碱解氮、速效磷和速效钾含量[J]. 农业工程学报, 2007, 112(1): 55-59. [19] 赵明松, 谢毅, 陆龙妹, 等. 基于高光谱特征指数的土壤有机质含量建模[J]. 土壤学报, 2021, 58(1): 42-54. [20] 陈秋宇, 杨仁敏, 朱长明. 基于 VIS-NIR 光谱的互花米草入侵湿地土壤有机碳预测研究[J]. 土壤学报, 2021, 58(3): 694-703. [21] QIAO Y, ZHANG S. Near-infrared spectroscopy technology for soil nutrients detection based on LS-SVM[C]//International Conference on Computer and Computing Technologies in Agriculture. Berlin, Heidelberg: Springer, 2012: 325-335.
[22] 陈滢伊, 司友涛, 鲍勇, 等. 隔离降雨对亚热带米槠天然林土壤可溶性有机质数量及光谱学特征的影响[J]. 应用生态学报, 2019, 30(9): 2964-2972. [23] LIU S, ZHU Y, LIU L, et al. Cation-induced coagulation of aquatic plant-derived dissolved organic matter: Investigation by EEM-PARAFAC and FT-IR spectroscopy[J]. Environmental Pollution, 2018, 234: 726-734. doi: 10.1016/j.envpol.2017.11.076
[24] 刘雪梅, 柳建设. 基于MC-UVE的土壤碱解氮和速效钾近红外光谱检测[J]. 农业机械学报, 2013, 44(3): 88-91. [25] 贾生尧, 杨祥龙, 李光, 等. 近红外光谱技术结合递归偏最小二乘算法对土壤速效磷与速效钾含量测定研究[J]. 光谱学与光谱分析, 2015, 35(9): 2516-2520. [26] 方向, 金秀, 朱娟娟, 等. 基于可见−近红外光谱预处理建模的土壤速效氮含量预测[J]. 浙江农业学报, 2019, 31(9): 1523-1530. [27] 汪六三, 鲁翠萍, 王儒敬, 等. 土壤碱解氮含量可见/近红外光谱预测模型优化[J]. 发光学报, 2018, 39(7): 1016-1023. [28] 何电源. 华南热带土壤养分含量状态及肥力评价[J]. 土壤学报, 1983, 20(2): 154-166. [29] 孟鑫鑫, 于雷, 周勇, 等. 基于可见近红外和中红外近地面光谱数据融合的土壤有机碳含量反演[J]. 土壤通报, 2022, 53(2): 301-307. [30] SHI Z, WANG Q L, PENG J, et al. Development of a national VNIR soil-spectral library for soil classification and prediction of organic matter concentrations[J]. Science China Earth Sciences, 2014, 57(7): 1671-1680. doi: 10.1007/s11430-013-4808-x
[31] TZIOLAS N, TSAKIRIDIS N, OGEN Y, et al. An integrated methodology using open soil spectral libraries and Earth Observation data for soil organic carbon estimations in support of soil-related SDGs[J]. Remote Sensing of Environment, 2020, 244: 111793. doi: 10.1016/j.rse.2020.111793
[32] 鲁如坤. 土壤农业化学分析方法[M]. 北京: 中国农业科技出版社, 1999: 146-191. [33] 刘磊, 沈润平, 丁国香. 基于高光谱的土壤有机质含量估算研究[J]. 光谱学与光谱分析, 2011, 31(3): 762-766. [34] 张雪莲, 李晓娜, 武菊英, 等. 不同类型土壤总氮的近红外光谱技术测定研究[J]. 光谱学与光谱分析, 2010, 30(4): 906-910. [35] 王昶. 近红外光谱快速评估土壤和有机肥质量研究[D]. 南京: 南京农业大学, 2014. [36] BEN-DOR E, HELLER D, CHUDNOVSKY A. A novel method of classifying soil profiles in the field using optical means[J]. Soil Science Society of America Journal, 2008, 72(4): 1113-1123. doi: 10.2136/sssaj2006.0059
[37] 曾招兵, 曾思坚, 汤建东, 等. 广东省耕地土壤有效磷时空变化特征及影响因素分析[J]. 生态环境学报, 2014, 23(3): 444-451. [38] 王文俊, 李志伟, 王璨, 等. 高光谱成像的褐土土壤速效钾含量预测[J]. 光谱学与光谱分析, 2019, 39(5): 1579-1585.


 下载:
下载:


