
Study on the extraction method of sugar tangerine fruit trees based on UAV remote sensing images
-
摘要:目的
通过无人机获取沙糖橘果园的遥感图像,快速提取果树分布位置,为果树的长势监测和产量预估提供参考。
方法以无人机拍摄的可见光遥感图像为研究对象,计算超红指数、超绿指数、超蓝指数、可见光波段差异植被指数、红绿比指数和蓝绿比指数6种可见光植被指数,使用双峰阈值法选取阈值进行果树的提取。在使用光谱指数进行识别的基础上,结合数字表面模型作为识别模型的输入变量,进行对比试验。
结果相比使用单一光谱指数,结合数字表面模型提高了果树和非果树像元的提取精度,6次波段融合后的总体精度均大于97%。超红指数与数字表面模型结合后的总体精度最高,为98.77%,Kappa系数为0.956 7,植被信息提取精度优于其他5种可见光植被指数与数字表面模型结合后的提取精度。
结论数字表面模型结合可见光植被指数的提取方法能够更深层次地挖掘遥感数据蕴含的信息量,为影像中色调相似地物的提取提供参考。
Abstract:ObjectiveTo obtain remote sensing image of sand sugar tangerine orchard by UAV, rapidly extract the distribution position of fruit trees, and provide references for growth monitoring and yield prediction of fruit trees.
MethodThe visible light remote sensing images taken by drones were used as the research object. Six visible light vegetation indexes of excess red index, excess green index, excess blue index, visible band differential vegetation index, red-green ratio index and blue-green ratio index were calculated. We used the double peak threshold method to select the threshold for fruit tree extraction. Based on the spectral index identification, digital surface model was added as input variable of the identification model, and the comparative test was conducted.
ResultCompared with using a single spectral index, the addition of digital surface model improved the extraction accuracies of fruit tree and non fruit tree pixels. The total accuracies of six band fusions were all greater than 97%. The total accuracy of excess red index combined with digital surface model was the highest (98.77%) with Kappa coefficient of 0.956 7, and the vegetation extraction accuracies were superior to those of other five combinations of visible light vegetation indexes with digital surface model.
ConclusionThe combination of digital surface model with visible light vegetation index can excavate more deeply the information contained in the remote sensing data, and provide a reference for the extraction of similar tonal features in the image.
-
-
![]()
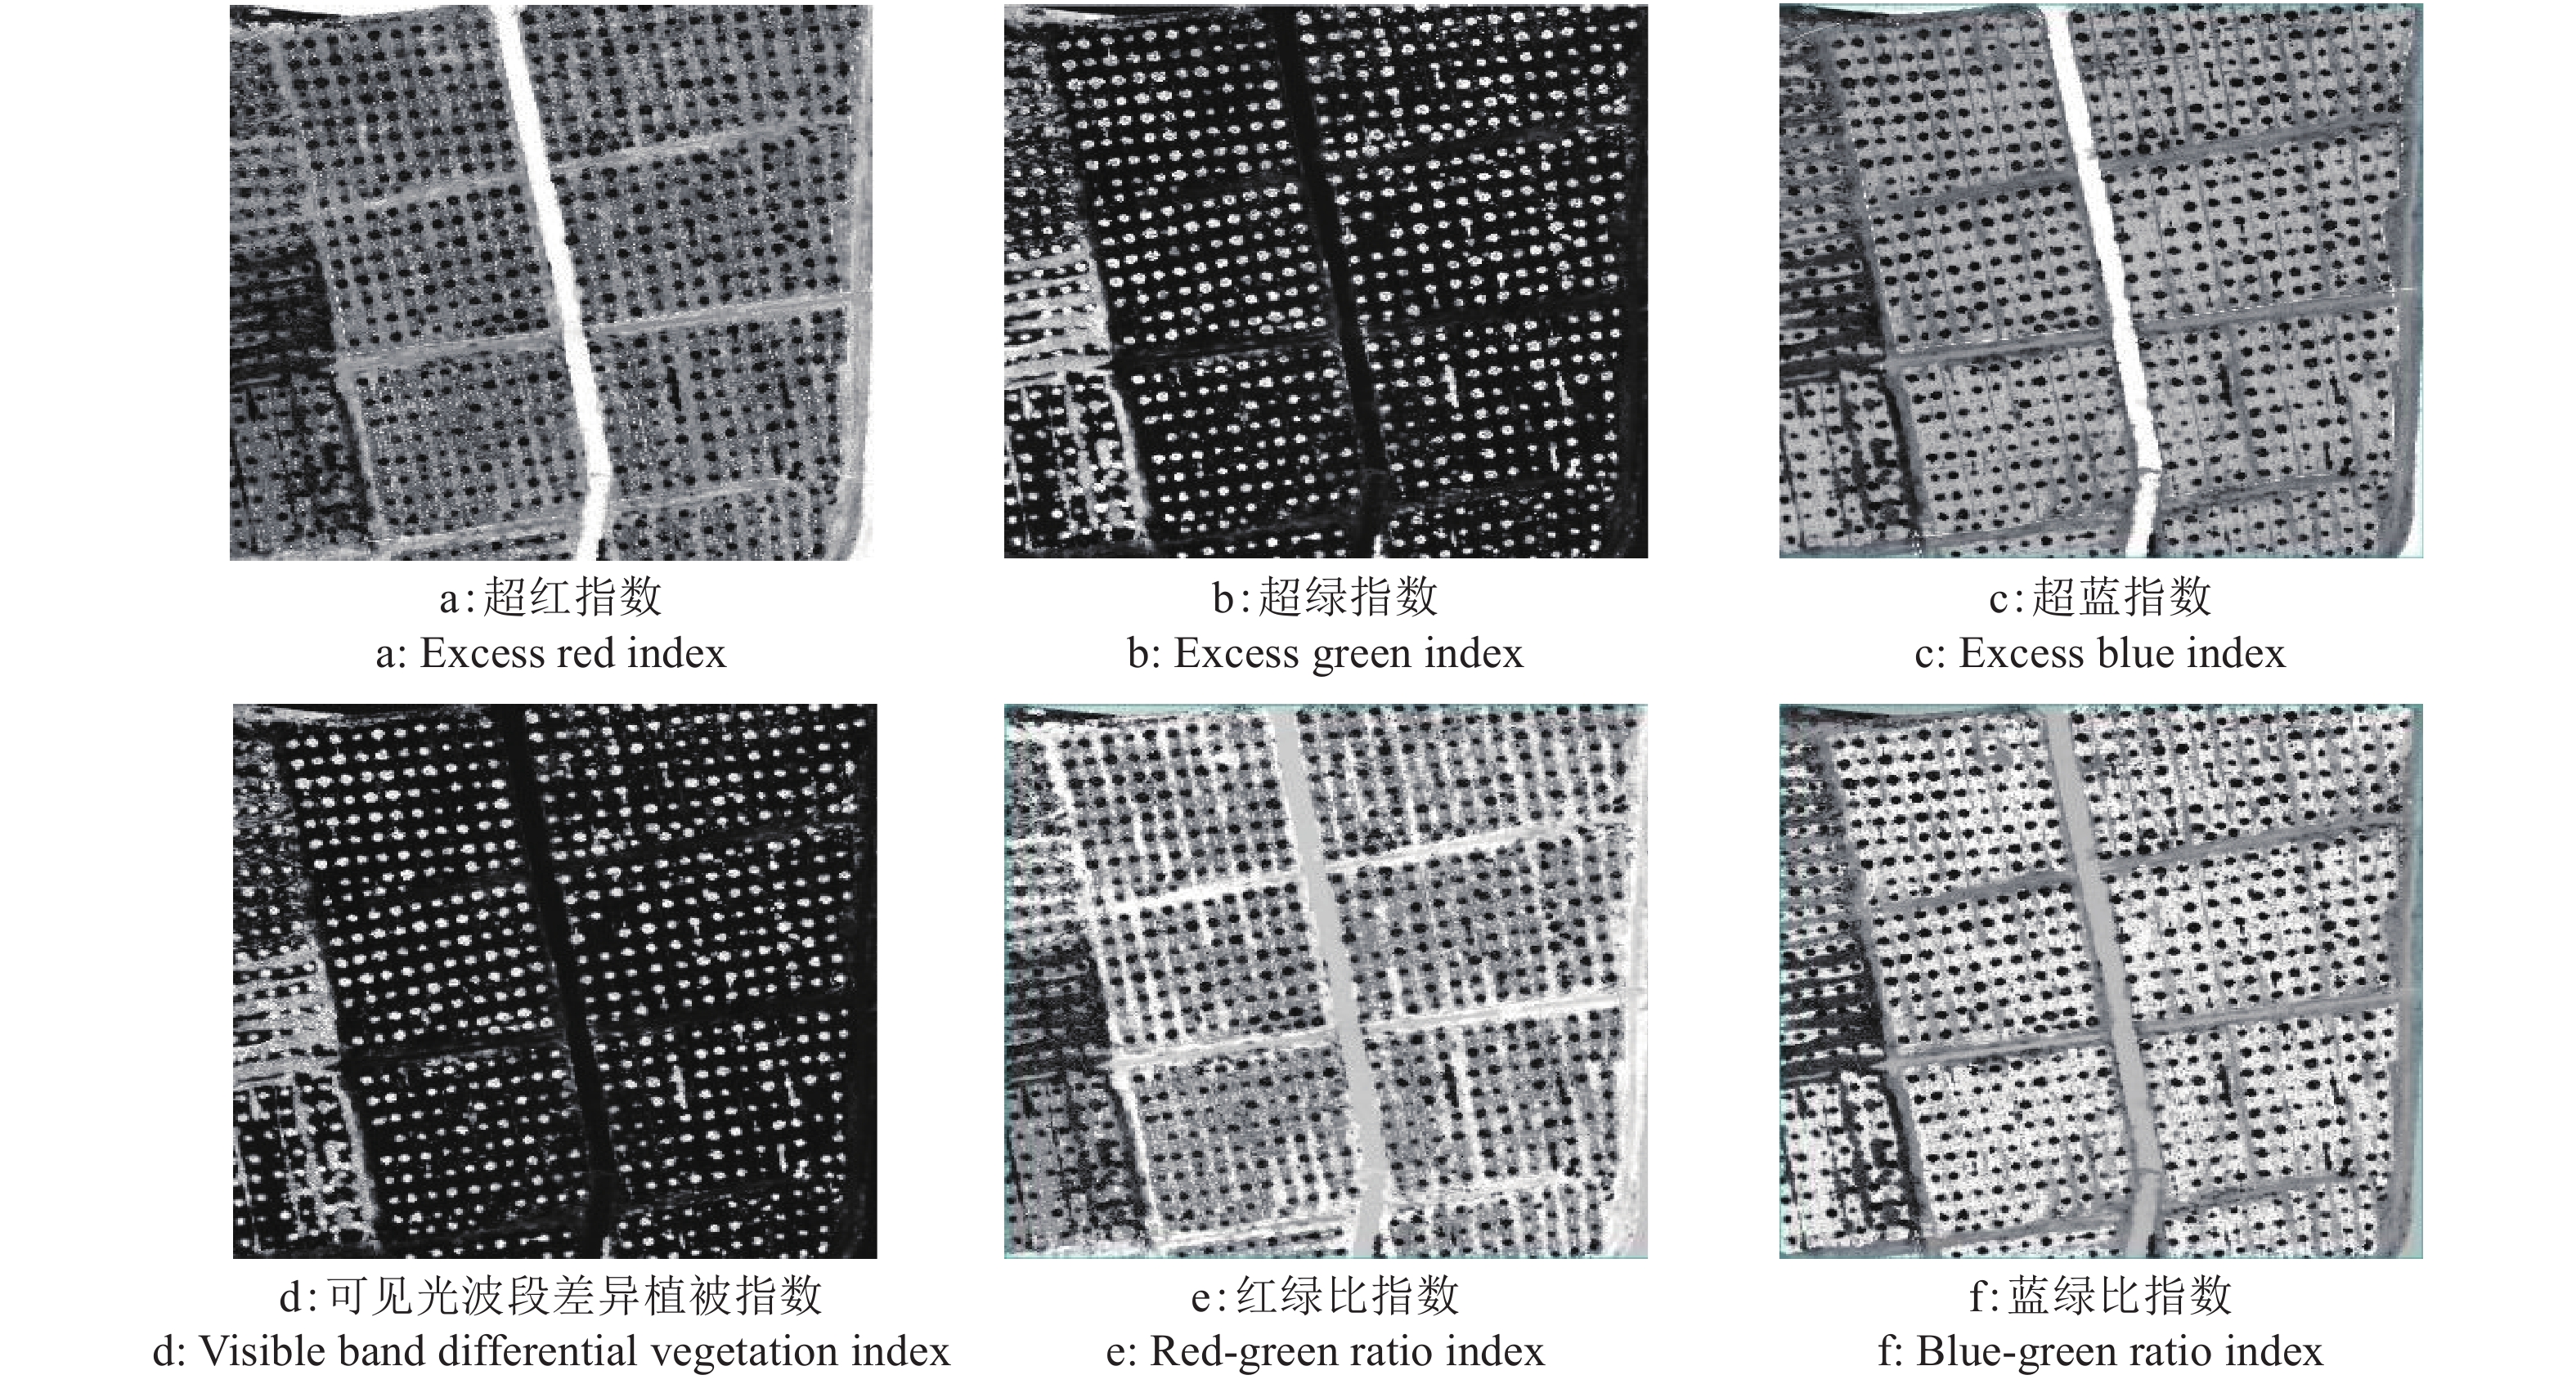
图 6 6种可见光植被指数计算结果
Figure 6. Calculation results of six visible light vegetation indexes
![]()
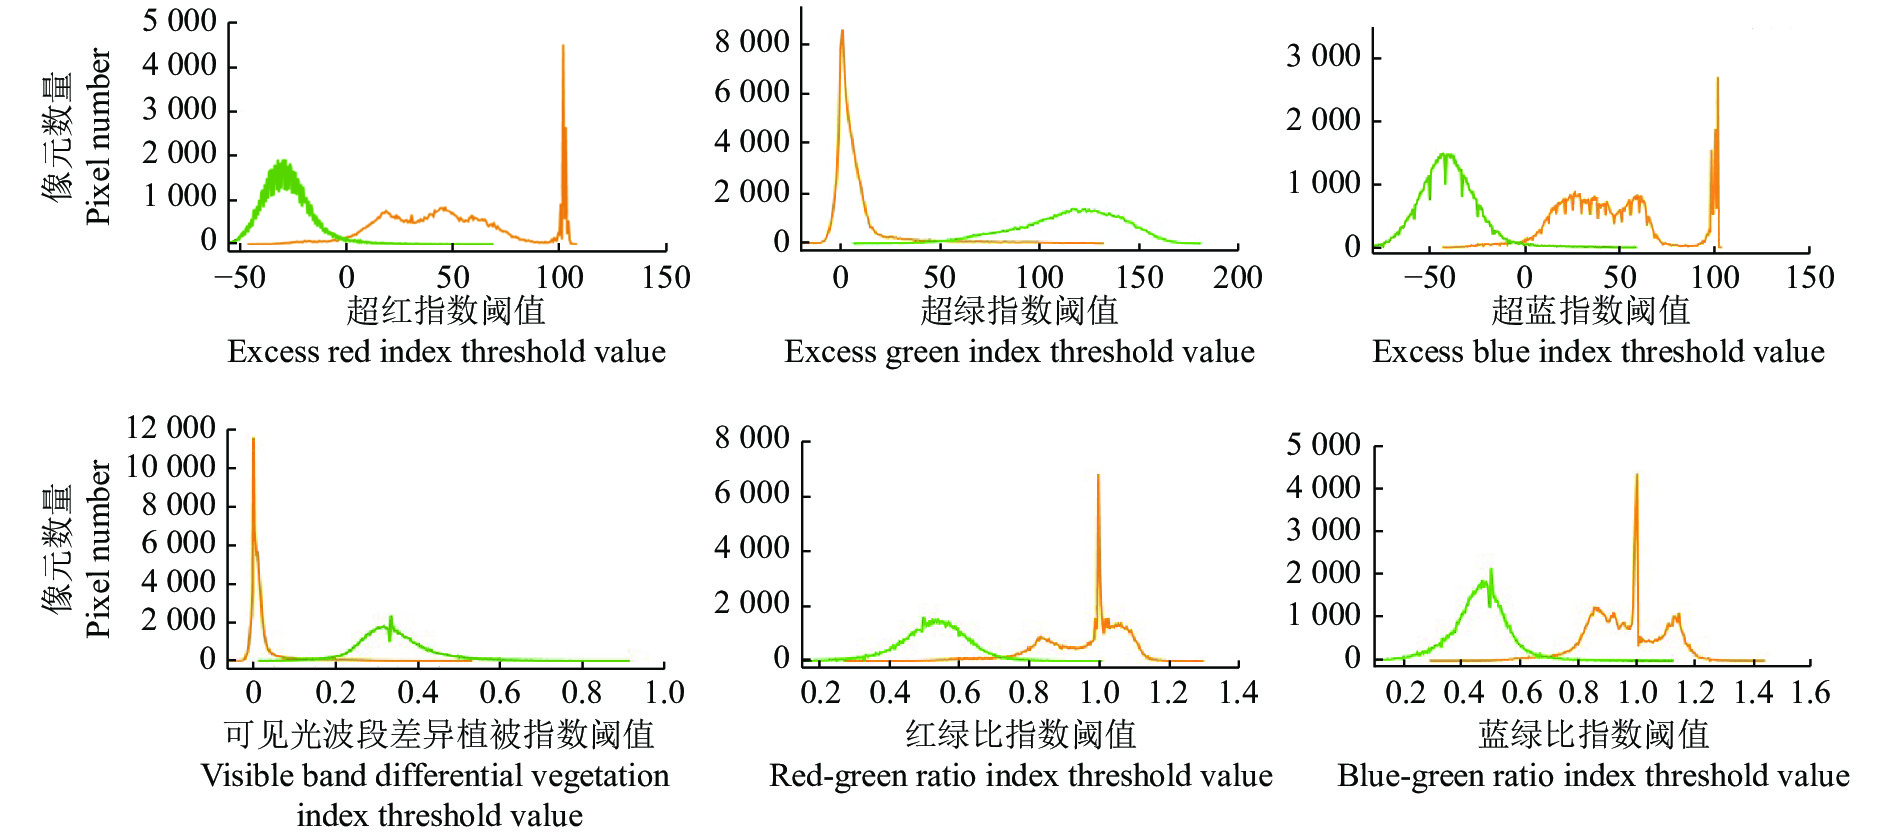
图 7 6种可见光植被指数统计直方图
Figure 7. Statistical histograms of six visible light vegetation indexes
![]()
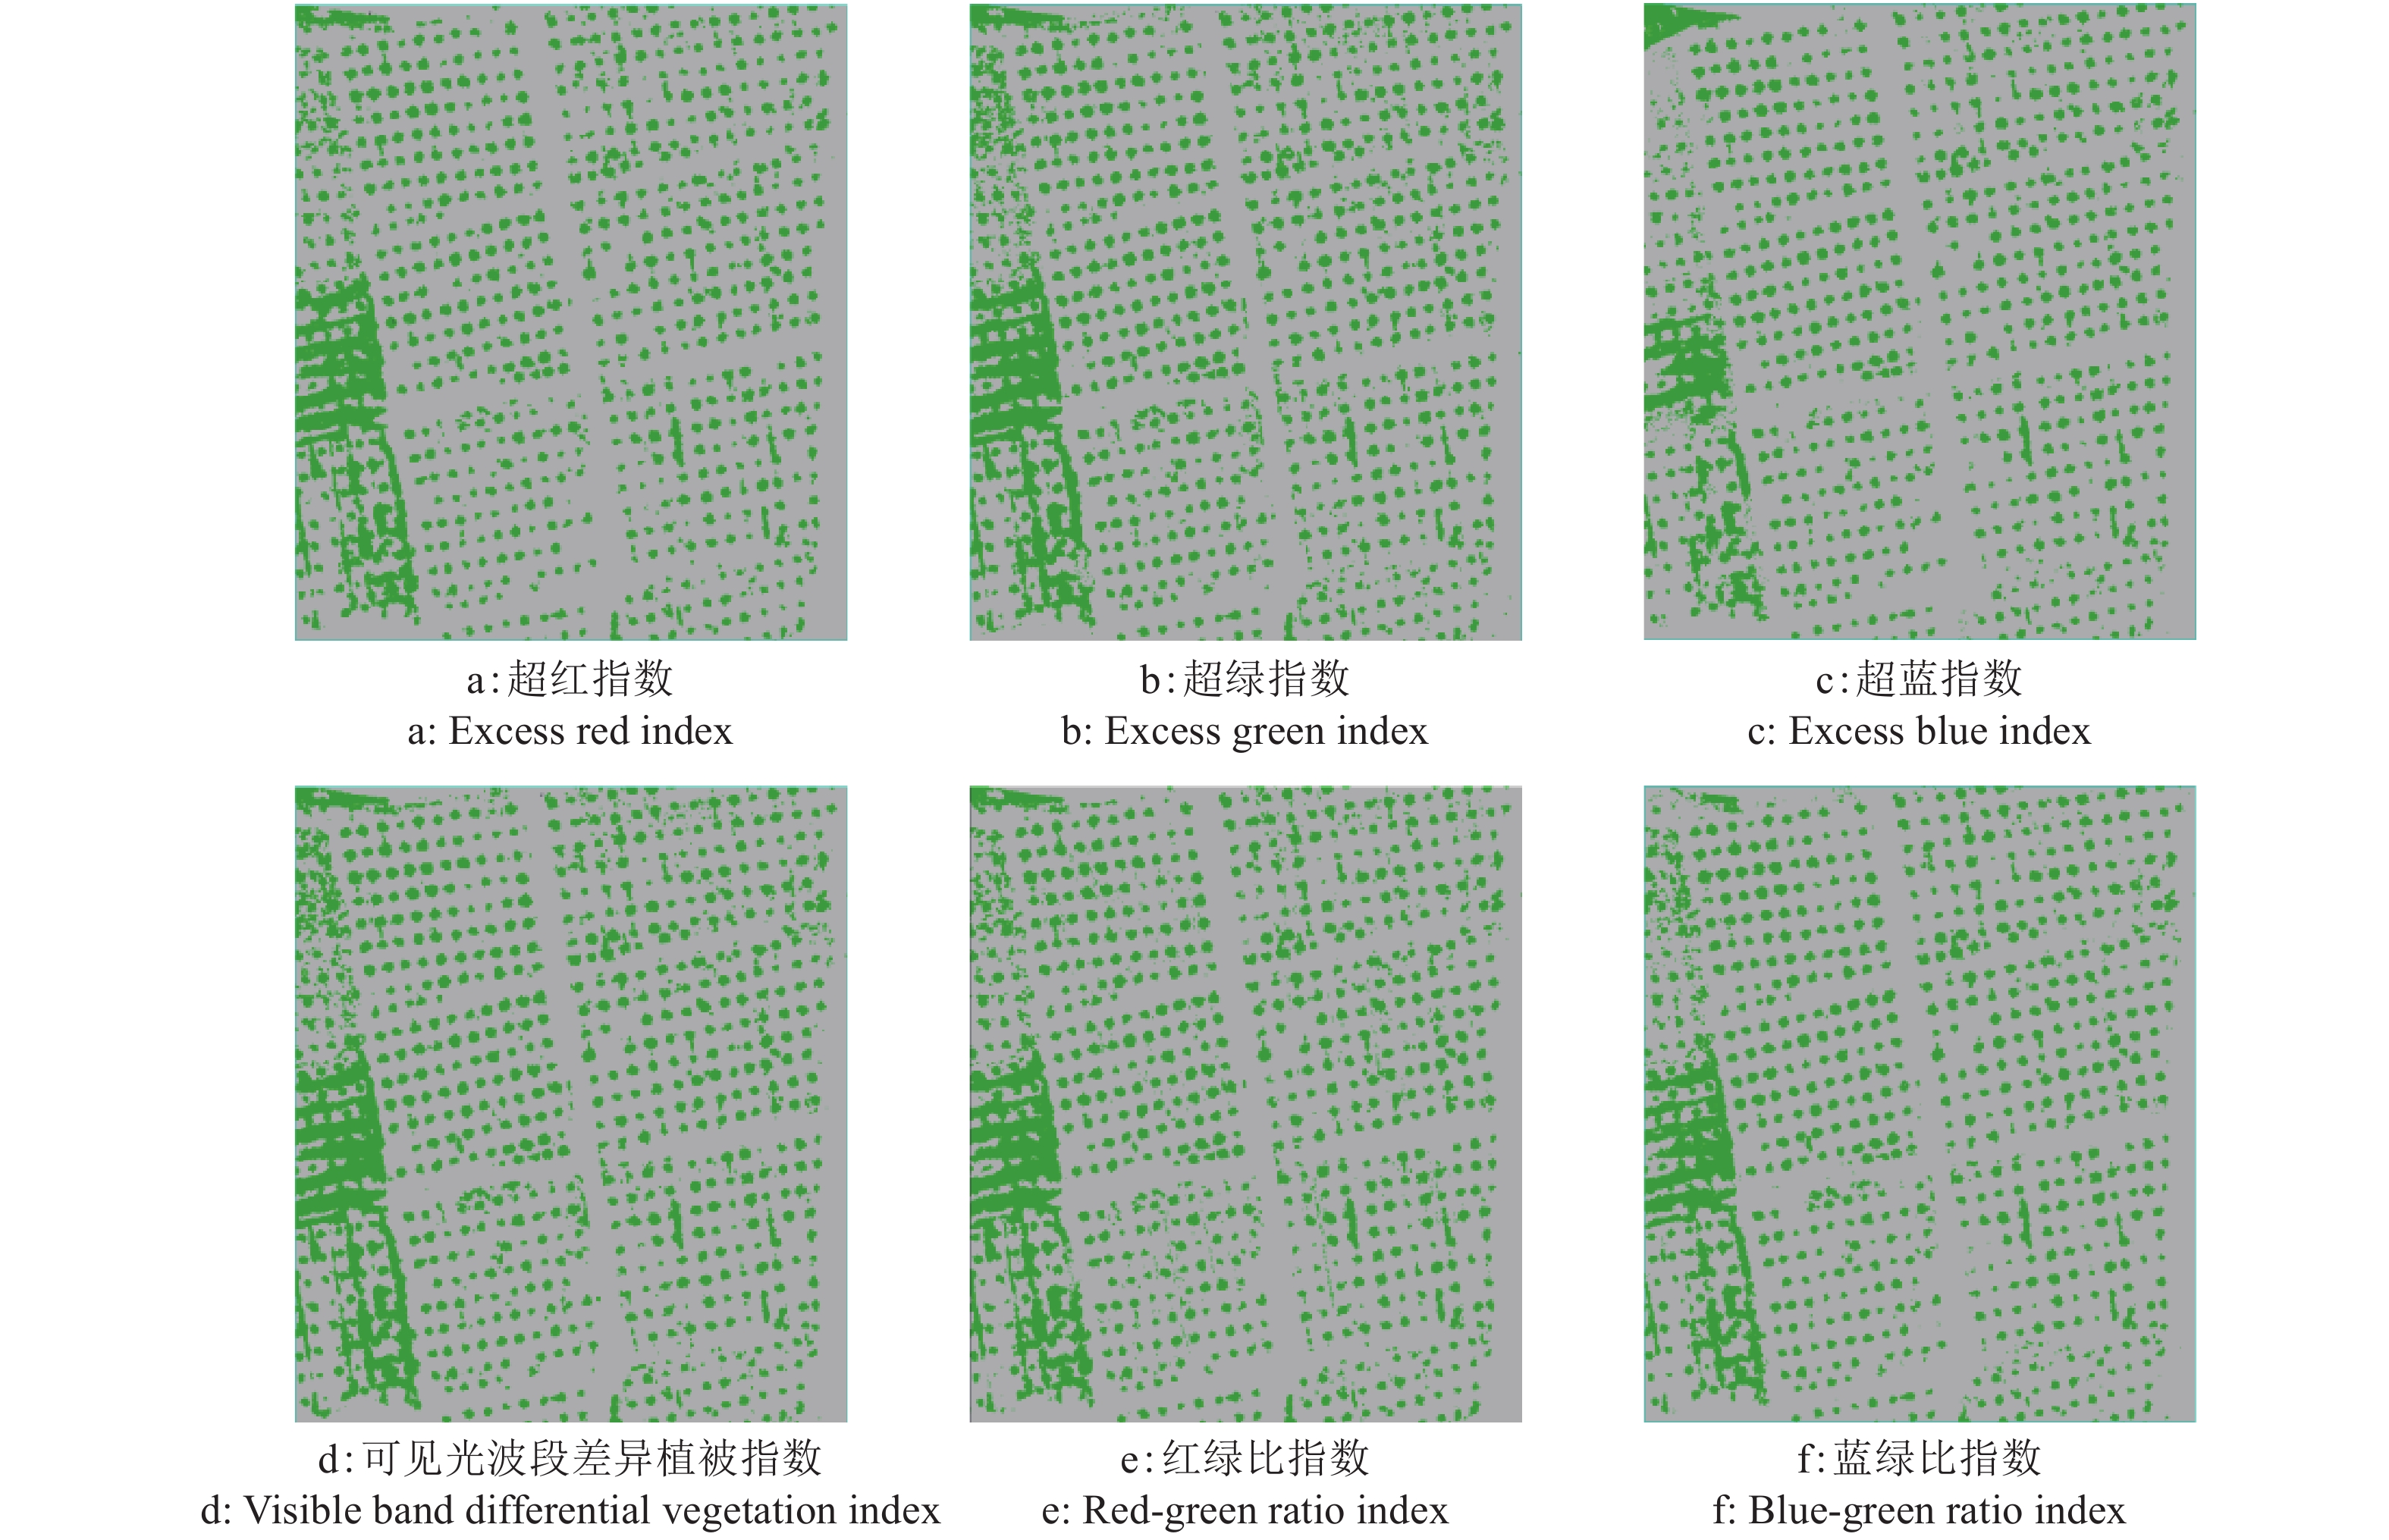
图 8 6种可见光植被指数的植被信息提取结果
绿色部分代表果树,灰色部分代表非果树
Figure 8. Vegetation extraction results of six visible light vegetation indexes
The green part indicates fruit tree, the gray part indicates non fruit tree
![]()
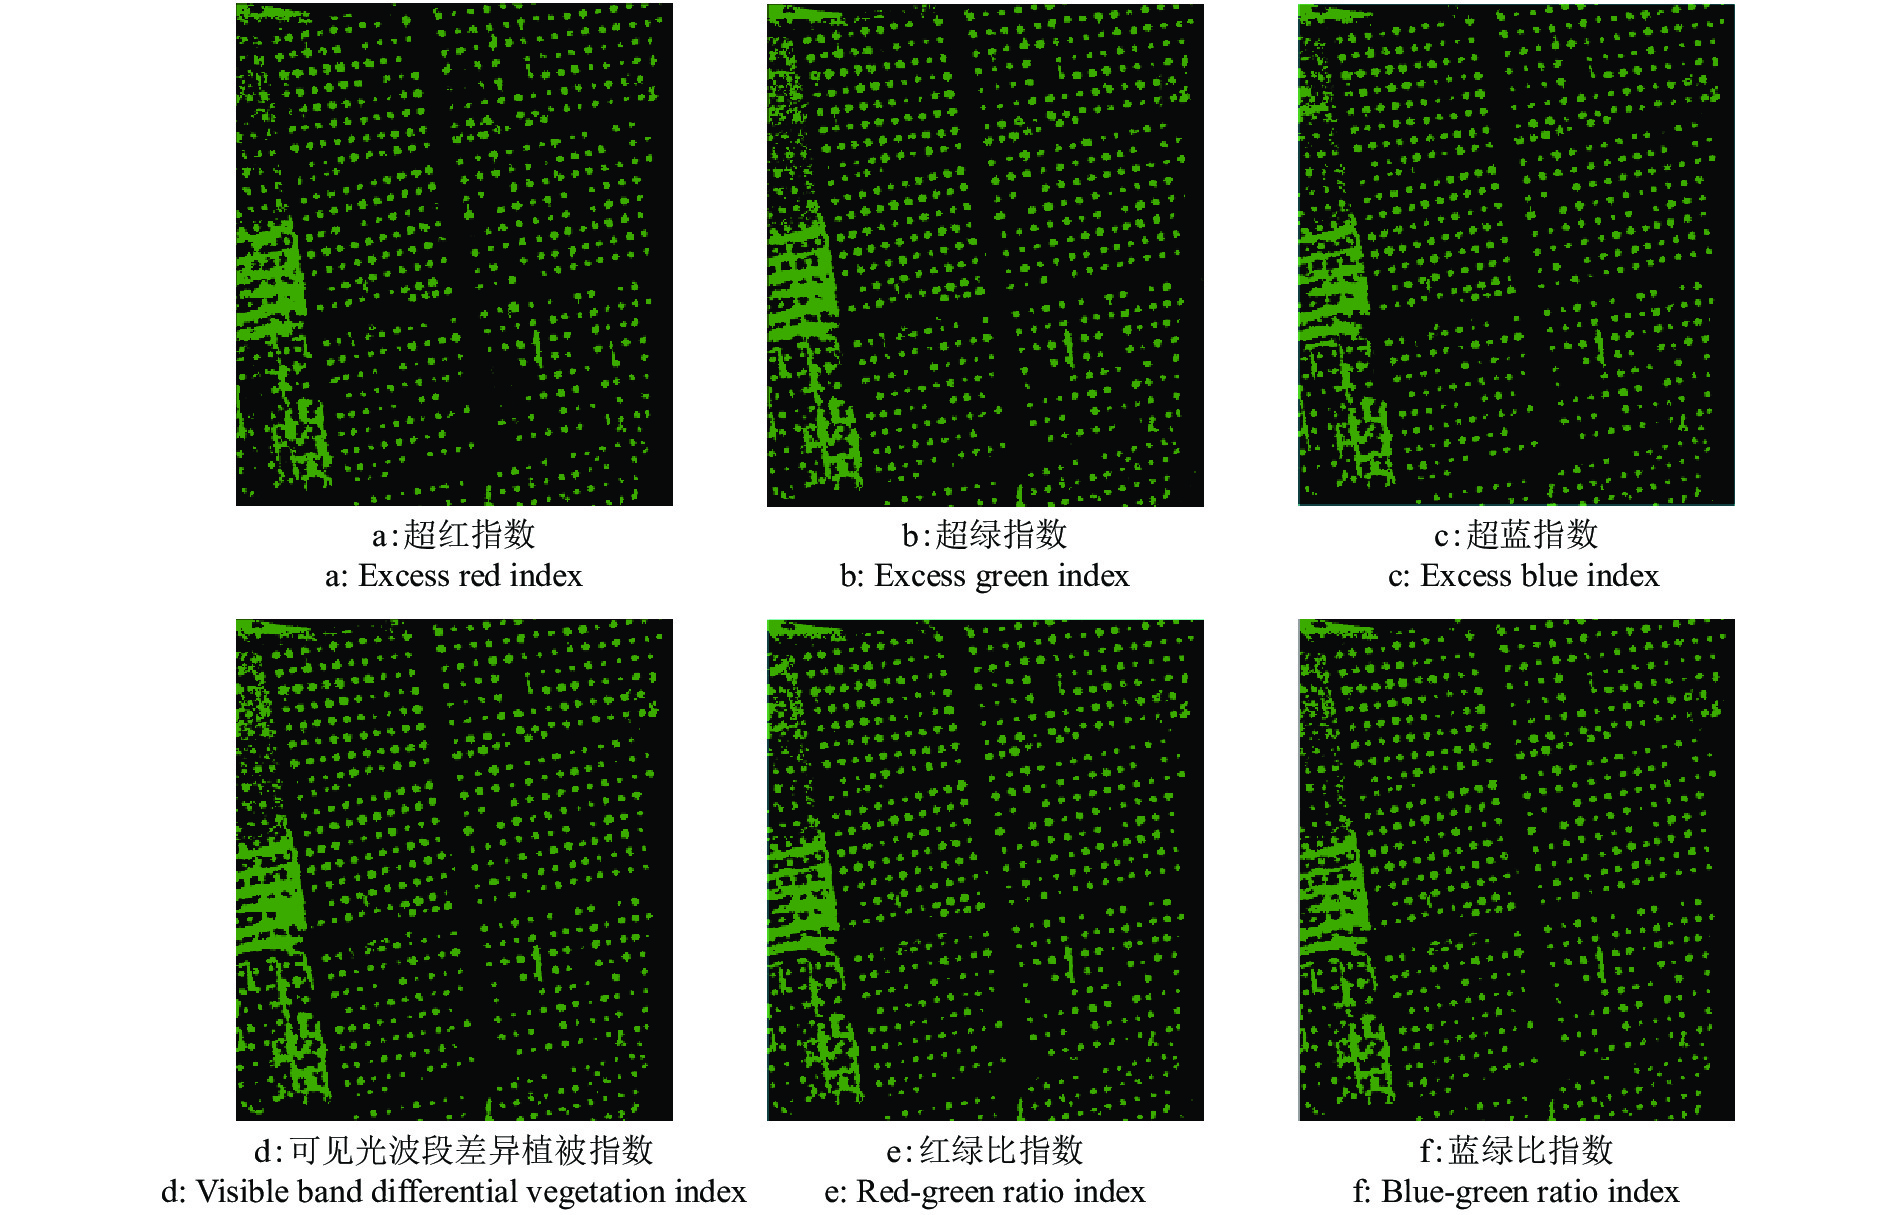
图 9 结合数字表面模型的6种可见光植被指数信息提取结果
绿色部分代表果树,黑色部分代表非果树
Figure 9. Extraction results of six visible light vegetation indexes combined with digital surface model
The green part indicates fruit tree, the black part indicates non fruit tree
表 1 可见光植被指数
Table 1 Vegetation indexes based on visible spectrum
植被指数 Vegetation index 表达式1) Equation 理论区间 Theory interval 超红指数 Excess red index $1.4R - G$ [−255, 357] 超绿指数 Excess green index $2G - R - B$ [−255, 510] 超蓝指数 Excess blue index $1.4B - G$ [−255, 357] 可见光波段差异植被指数 Visible band differential vegetation index $\dfrac{ {2G - R - B} }{ {2G + R + B} }$ [−1, 1] 红绿比指数 Red-green ratio index $\dfrac{R}{G}$ [−1, 1] 蓝绿比指数 Blue-green ratio index $\dfrac{B}{G}$ [−1, 1] 1) R:红光波段,G:绿光波段,B:蓝光波段
1) R: Red light wave band, G: Green light wave band, B: Blue light wave band 下载: 导出CSV
表 2 基于感兴趣区域的6种可见光植被指数的统计值
Table 2 Statistics of six visible light vegetation indexes based on region of interest
植被指数
Vegetation index果树 Fruit tree 非果树 Non fruit tree 平均值
Mean标准差
Standard deviation平均值
Mean标准差
Standard deviation超红指数 Excess red index −27.293 4 11.959 8 46.642 1 30.383 9 超绿指数 Excess green index 115.230 7 25.873 2 9.023 5 18.045 8 超蓝指数 Excess blue index −39.266 7 15.487 6 44.257 4 28.460 9 可见光波段差异植被指数 Visible band differential vegetation index 0.339 2 0.087 9 0.021 8 0.046 3 红绿比指数 Red-green ratio index 0.532 7 0.097 3 0.960 9 0.119 6 蓝绿比指数 Blue-green ratio index 0.466 5 0.104 1 0.960 5 0.130 6
下载: 导出CSV
表 3 6种可见光植被指数的植被提取精度评价
Table 3 Accuracy assessments of vegetation extraction for six visible light vegetation indexes
植被指数
Vegetation index阈值
Threshold精度/% Accuracy Kappa系数(K)
Kappa coefficient果树
Fruit tree非果树
Non fruit tree总体
Total超红指数 Excess red index −1.886 99.78 90.63 95.18 0.903 6 超绿指数 Excess green index 50.000 99.68 87.58 93.60 0.872 0 超蓝指数 Excess blue index −4.675 99.77 94.62 97.18 0.943 6 可见光波段差异植被指数
Visible band differential vegetation index0.133 99.98 88.28 94.10 0.882 0 红绿比指数 Red-green ratio index 0.724 99.84 89.25 94.52 0.890 4 蓝绿比指数 Blue-green ratio index 0.682 99.79 91.40 95.57 0.911 4
下载: 导出CSV
表 4 6种可见光植被指数融合数字表面模型提取精度评价
Table 4 Accuracy assessments of vegetation extraction for six visible vegetation indexes combined with digital surface model
植被指数
Vegetation index精度/% Accuracy Kappa系数(K)
Kappa coefficient果树 Fruit tree 非果树 Non fruit tree 总体 Total 超红指数 Excess red index 99.46 98.08 98.77 0.956 7 超绿指数 Excess green index 99.28 95.26 97.27 0.945 4 超蓝指数 Excess blue index 99.45 95.43 97.44 0.948 9 可见光波段差异植被指数
Visible band differential vegetation index99.76 95.58 97.67 0.953 4 红绿比指数 Red-green ratio index 99.31 96.37 97.84 0.956 8 蓝绿比指数 Blue-green ratio index 99.23 96.45 97.84 0.956 8
下载: 导出CSV
-
[1] 牛亚晓, 张立元, 韩文霆, 等. 基于无人机遥感与植被指数的冬小麦覆盖度提取方法[J]. 农业机械学报, 2018, 49(4): 212-221. doi: 10.6041/j.issn.1000-1298.2018.04.024 [2] GITELSON A A, KAUFMAN Y J, STARK R, et al. Novel algorithms for remote estimation of vegetation fraction[J]. Remote Sens Environ, 2002, 80(1): 76-87. doi: 10.1016/S0034-4257(01)00289-9
[3] YANG H B, ZHAO J, LAN Y B, et al. Fraction vegetation cover extraction of winter wheat based on spectral information and texture features obtained by UAV[J]. Int J Precis Agric Aviat, 2019, 2(2): 54-61.
[4] TAHIR M N, LAN Y B, ZHANG Y L, et al. Real time estimation of leaf area index and groundnut yield using multispectral UAV[J]. Int J Precis Agric Aviat, 2020, 3(1): 1-6.
[5] XU W, LAN Y, LI Y, et al. Classification method of cultivated land based on UAV visible light remote sensing[J]. Int J Agr Biol Eng, 2019, 12(3): 103-109.
[6] CHOI S K, LEE S K, JUNG S H, et al. Estimation of fractional vegetation cover in sand dunes using multi-spectral images from fixed-wing UAV[J]. Journal of the Korean Society of Survey, Geodesy, Photogrammetry, and Cartography, 2016, 34(4): 431-441. doi: 10.7848/ksgpc.2016.34.4.431
[7] ZHANG D, MANSARAY L R, JIN H, et al. A universal estimation model of fractional vegetation cover for different crops based on time series digital photographs[J]. Comput Electron Agr, 2018, 151: 93-103. doi: 10.1016/j.compag.2018.05.030
[8] 高永平, 康茂东, 何明珠, 等. 基于无人机可见光波段对荒漠植被覆盖度提取的研究[J]. 兰州大学学报(自然科学版), 2018, 54(6): 770-775. [9] MEYER G E, NETO J C. Verification of color vegetation indices for automated crop imaging applications[J]. Comput Electron Agr, 2008, 63(2): 282-293. doi: 10.1016/j.compag.2008.03.009
[10] WOEBBECKE D M, MEYER G E, VON BARGEN K, et al. Color indices for weed identification under various soil, residue, and lighting conditions[J]. Transactions of the ASAE, 1995, 38(1): 259-269. doi: 10.13031/2013.27838
[11] GUIJARRO M, PAJARES G, RIOMOROS I, et al. Automatic segmentation of relevant textures in agricultural images[J]. Comput Electron Agr, 2011, 75(1): 75-83. doi: 10.1016/j.compag.2010.09.013
[12] GAMON J A, SURFUS J S. Assessing leaf pigment content and activity with a reflectometer[J]. New Phytol, 1999, 143(1): 105-117. doi: 10.1046/j.1469-8137.1999.00424.x
[13] SELLARO R, CREPY M, TRUPKIN S A, et al. Cryptochrome as a sensor of the blue/green ratio of natural radiation in Arabidopsis[J]. Plant Physiol, 2010, 154(1): 401-409. doi: 10.1104/pp.110.160820
[14] PUREVDORJ T, TATEISHI R, ISHIYAMA T, et al. Relationships between percent vegetation cover and vegetation indices[J]. Int J Remote Sens, 1998, 19(18): 3519-3535. doi: 10.1080/014311698213795
[15] 赵德升, 毛罕平, 陈树人, 等. 杂草识别中背景分割方法的比较研究[J]. 农机化研究, 2009(11): 76-79. [16] 邓书斌, 陈秋锦. EVVI遥感图像处理方法[M]. 北京: 高等教育出版社, 2014: 204. [17] 王民, 樊潭飞, 贠卫国, 等. PFWG 改进的 CNN 多光谱遥感图像分类[J]. 激光与光电子学进展, 2019, 56(3): 031003.
计量
- 文章访问数: 1037
- HTML全文浏览量: 4
- PDF下载量: 1271
