Temporal and spatial distribution characteristics of air pollutants from open burning of rice straw in Guangdong Province
-
摘要:目的
了解广东省水稻秸秆露天焚烧大气污染物排放情况,为水稻秸秆的资源化利用以及大气污染治理提供一定的参考。
方法基于广东省历年的稻谷产量、草谷比、水稻秸秆焚烧比例和焚烧效率指标,利用排放因子法估算了1990—2016年间广东省水稻秸秆产量及露天焚烧大气污染物的排放量,利用ArcGIS10.2软件分析了大气污染物排放的时空分布特征。
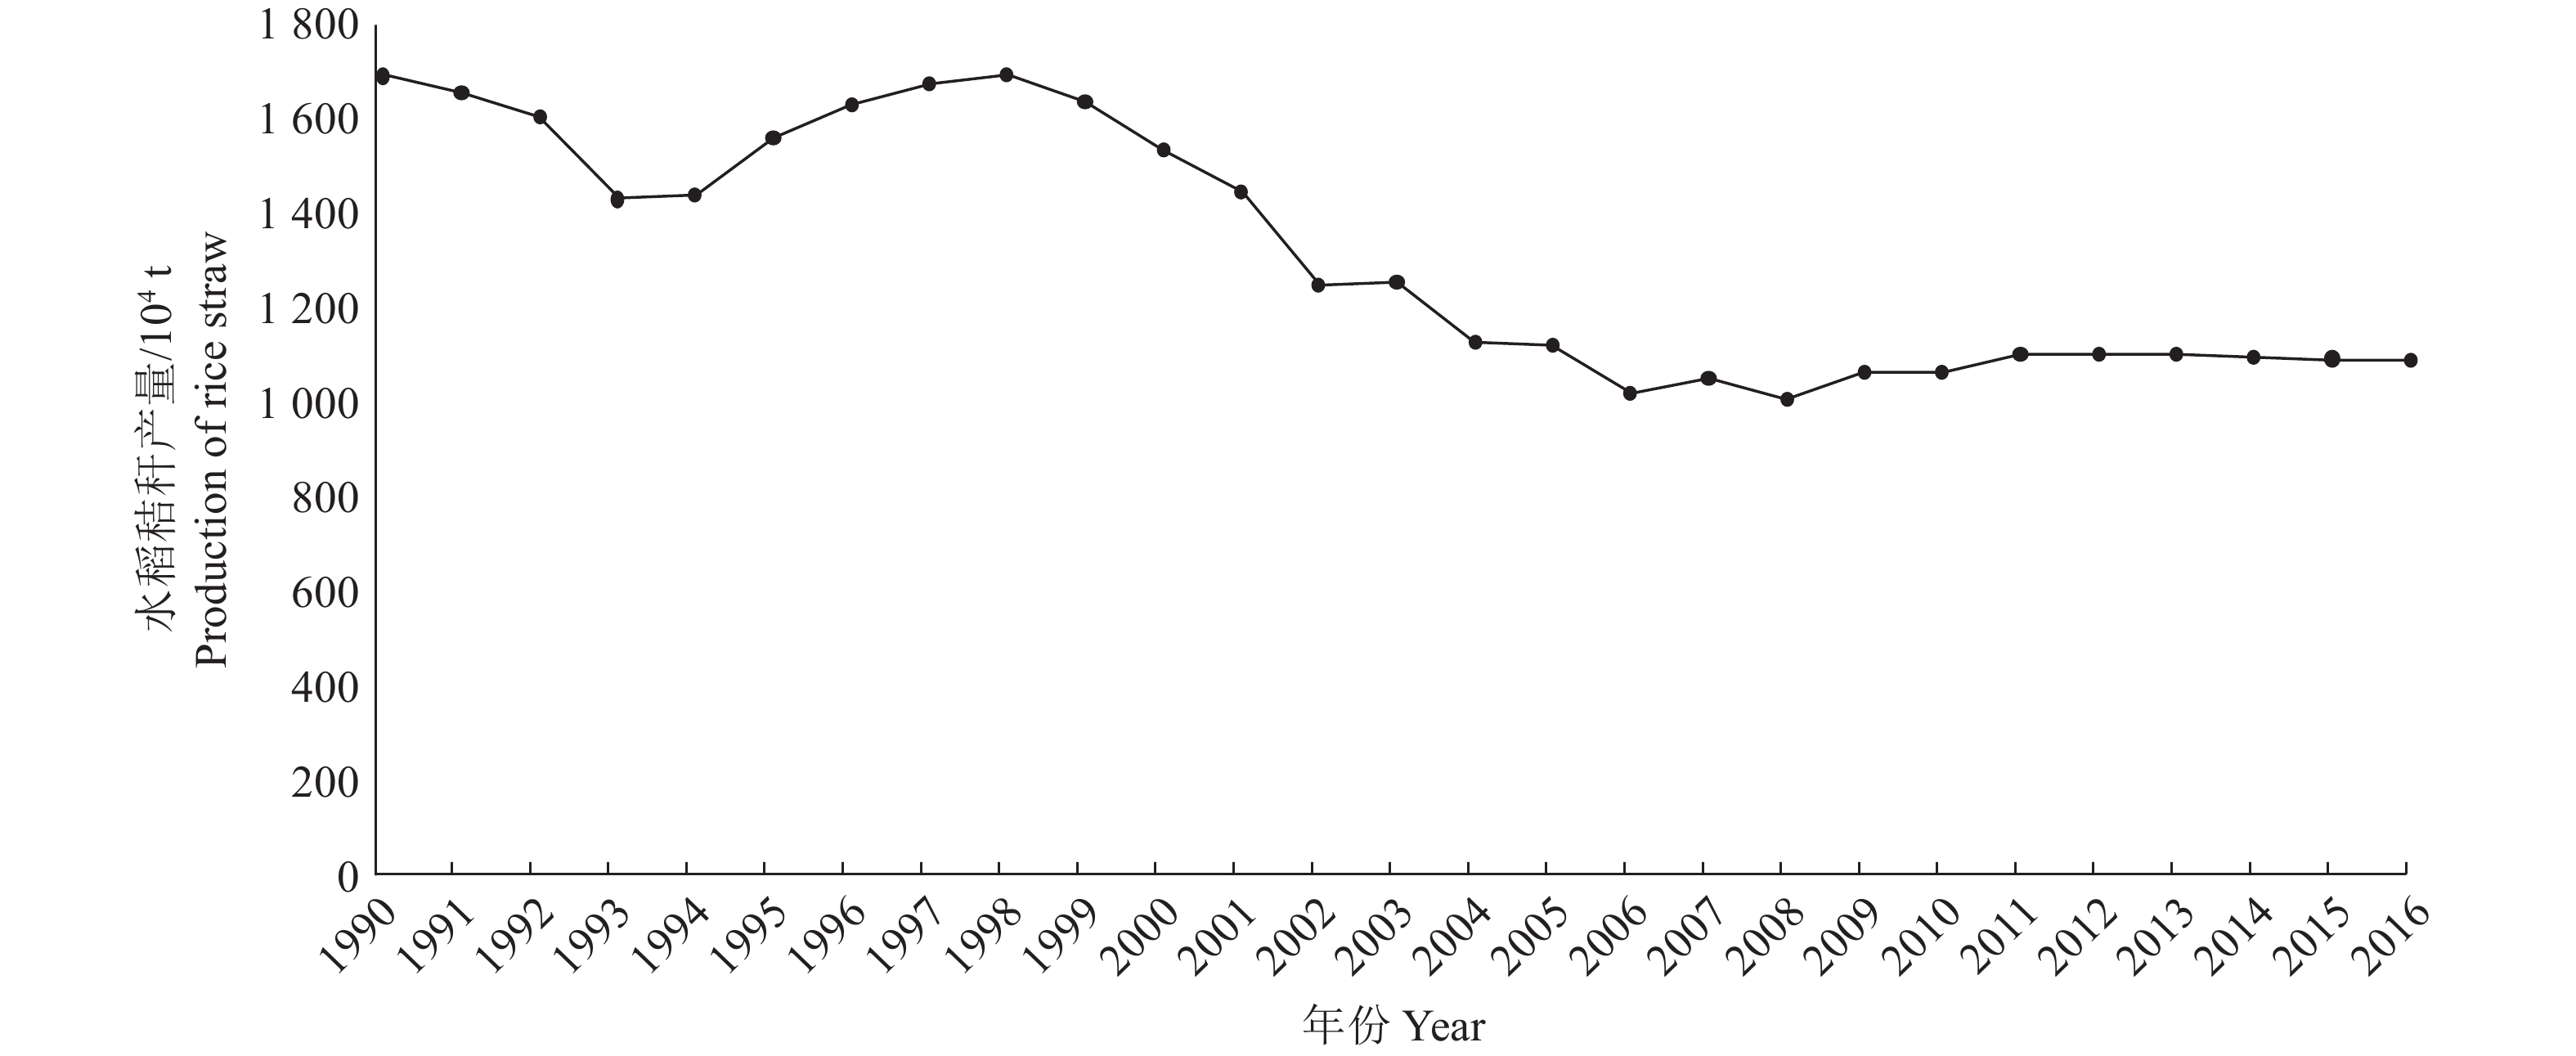
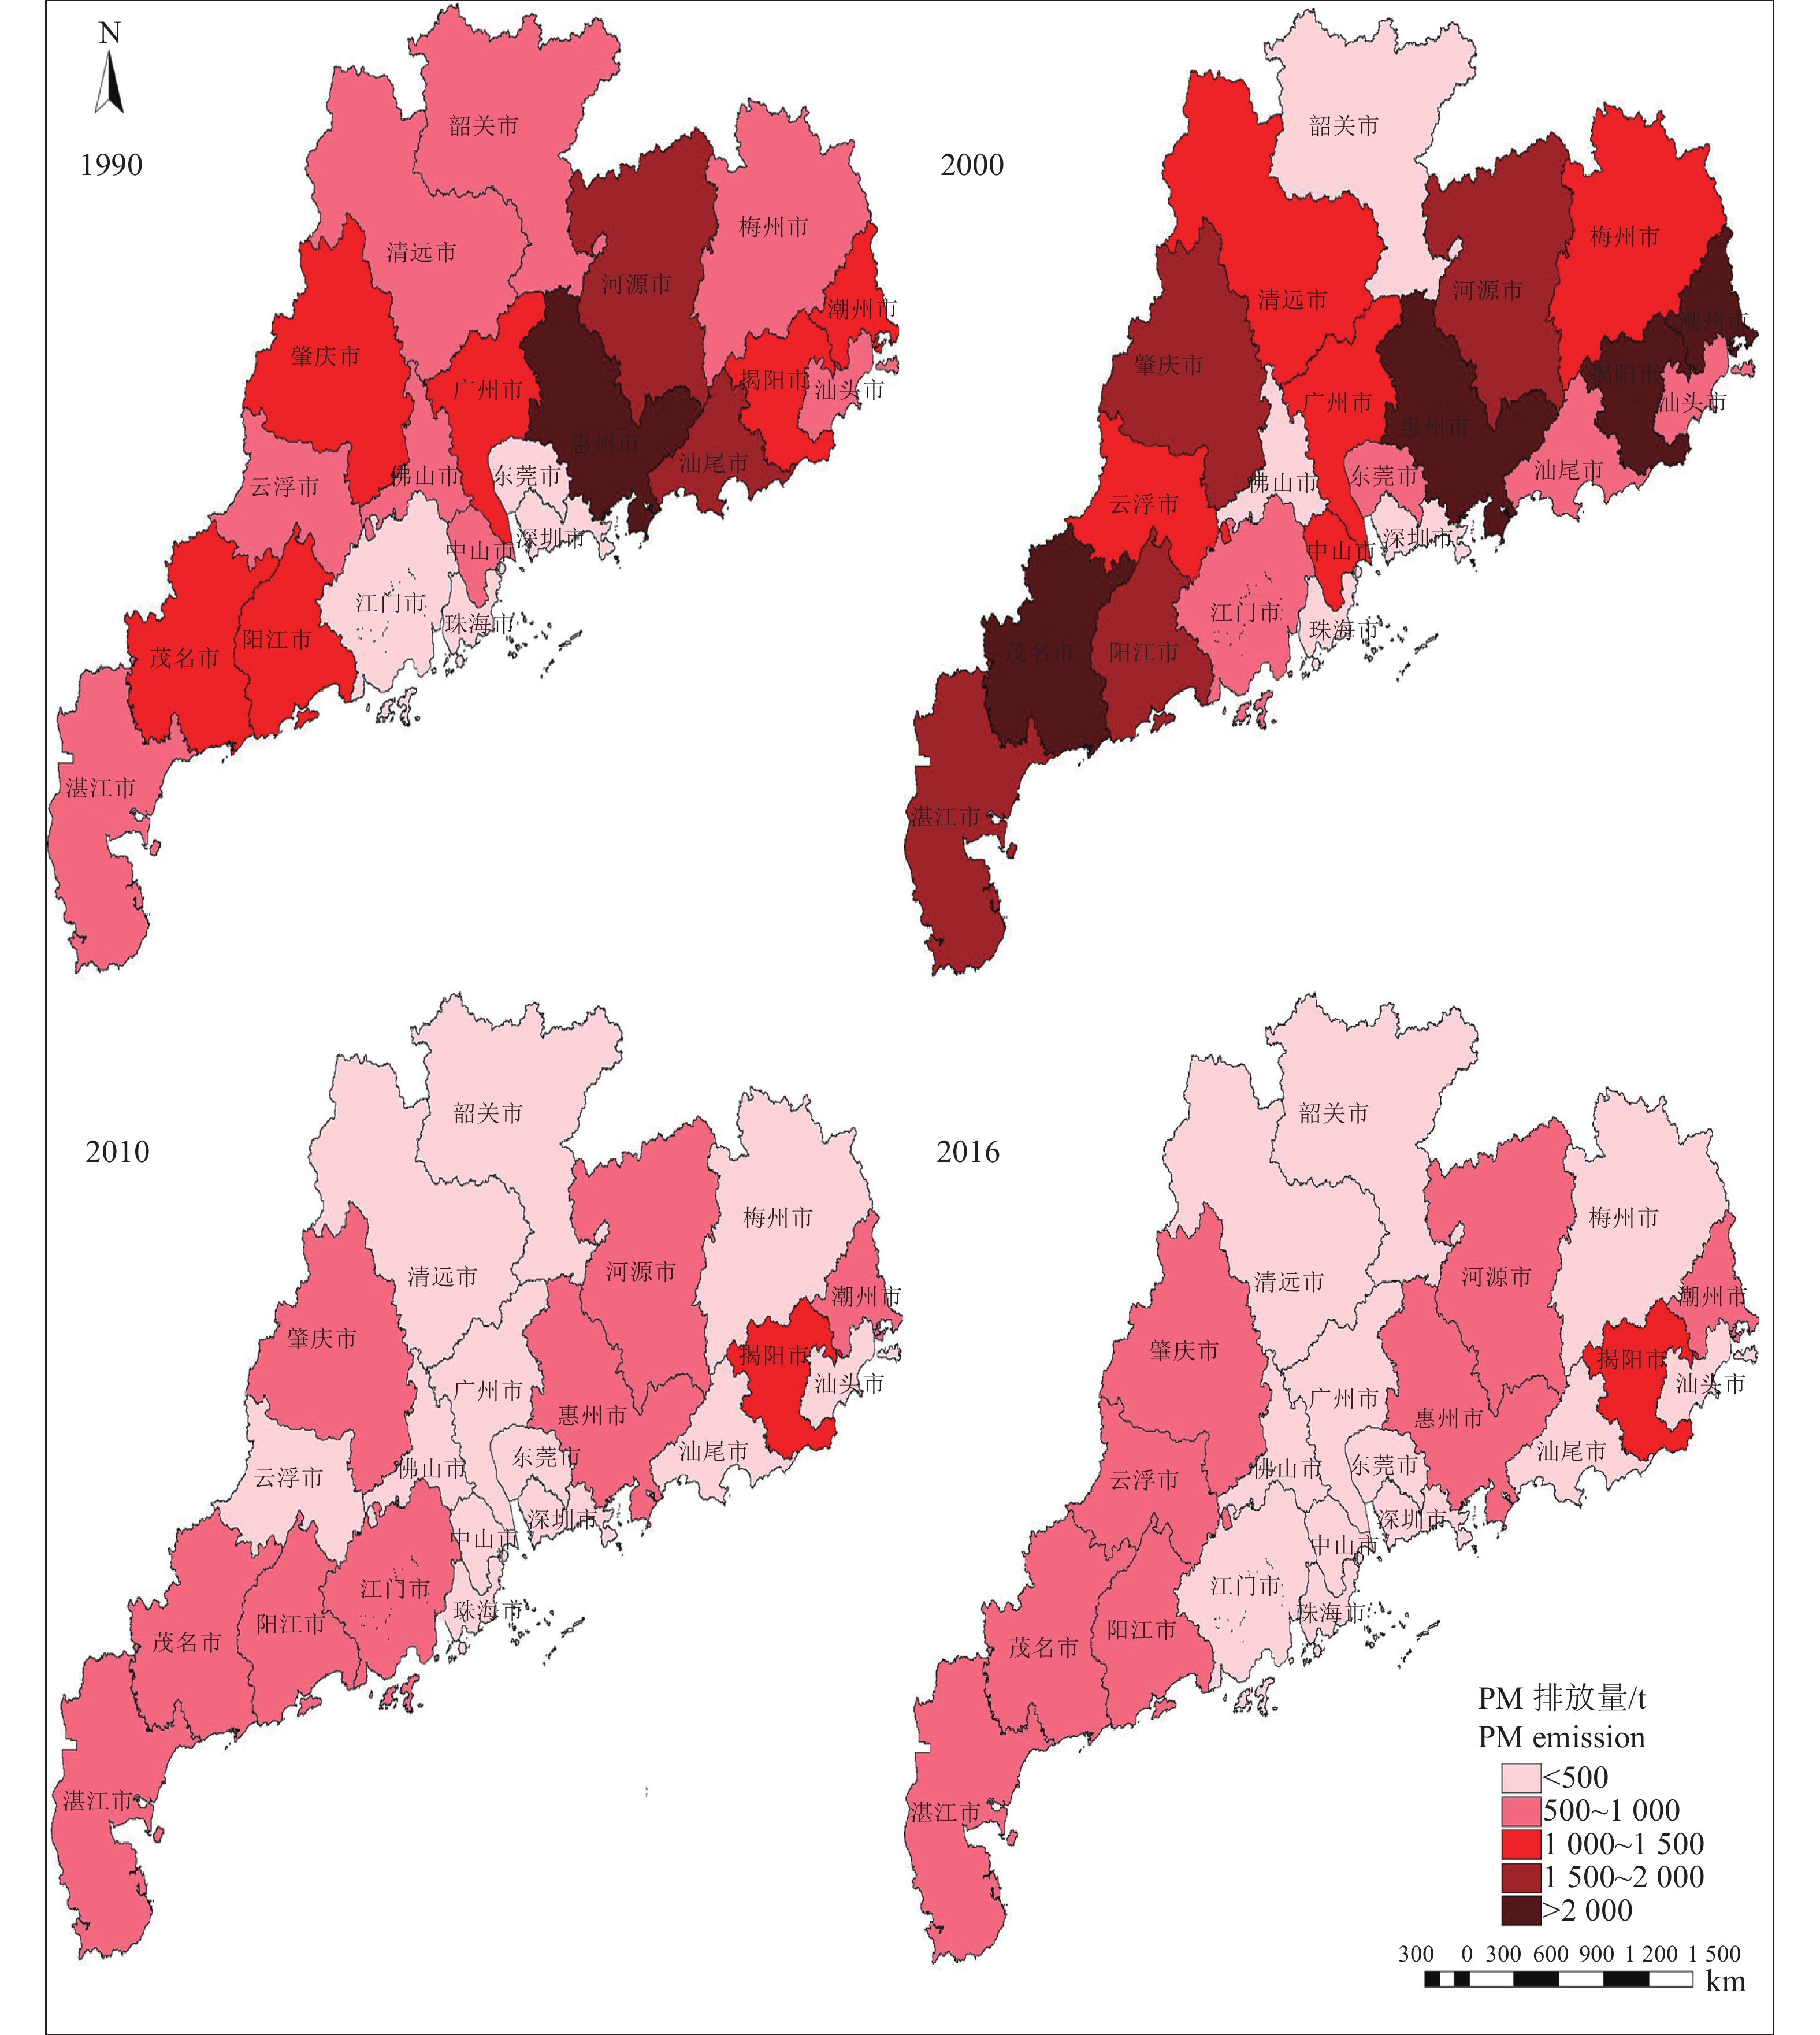
结果1990—2016年间,广东省水稻秸秆资源量呈“下降−上升−下降−上升”的变化趋势,整体上由1990年的1 687 万t下降到2016年的1 087 万t,年平均减少率为1.7%。研究期间,PM、BC、OC、SO2、NOx、CH4、CO和CO2的排放量分别减少了8 800、200、5 200、1 100、800、2 900、106 500和2 585 800 t,减少率分别为48.09%、50.00%、48.60%、50.00%、50.00%、48.33%、48.45%和48.45%。广东省各地区水稻秸秆露天焚烧污染物排放量的空间分布表现出不均衡性,1990年,茂名、阳江、肇庆、广州、惠州、河源、汕尾、揭阳及潮州市的排放量较大,PM的排放总量均在1 000 t以上;2000年,大部分地市的PM排放量均在1 000 t以上;2010—2016年间,除揭阳市外,PM的排放量均低于1 000 t 。
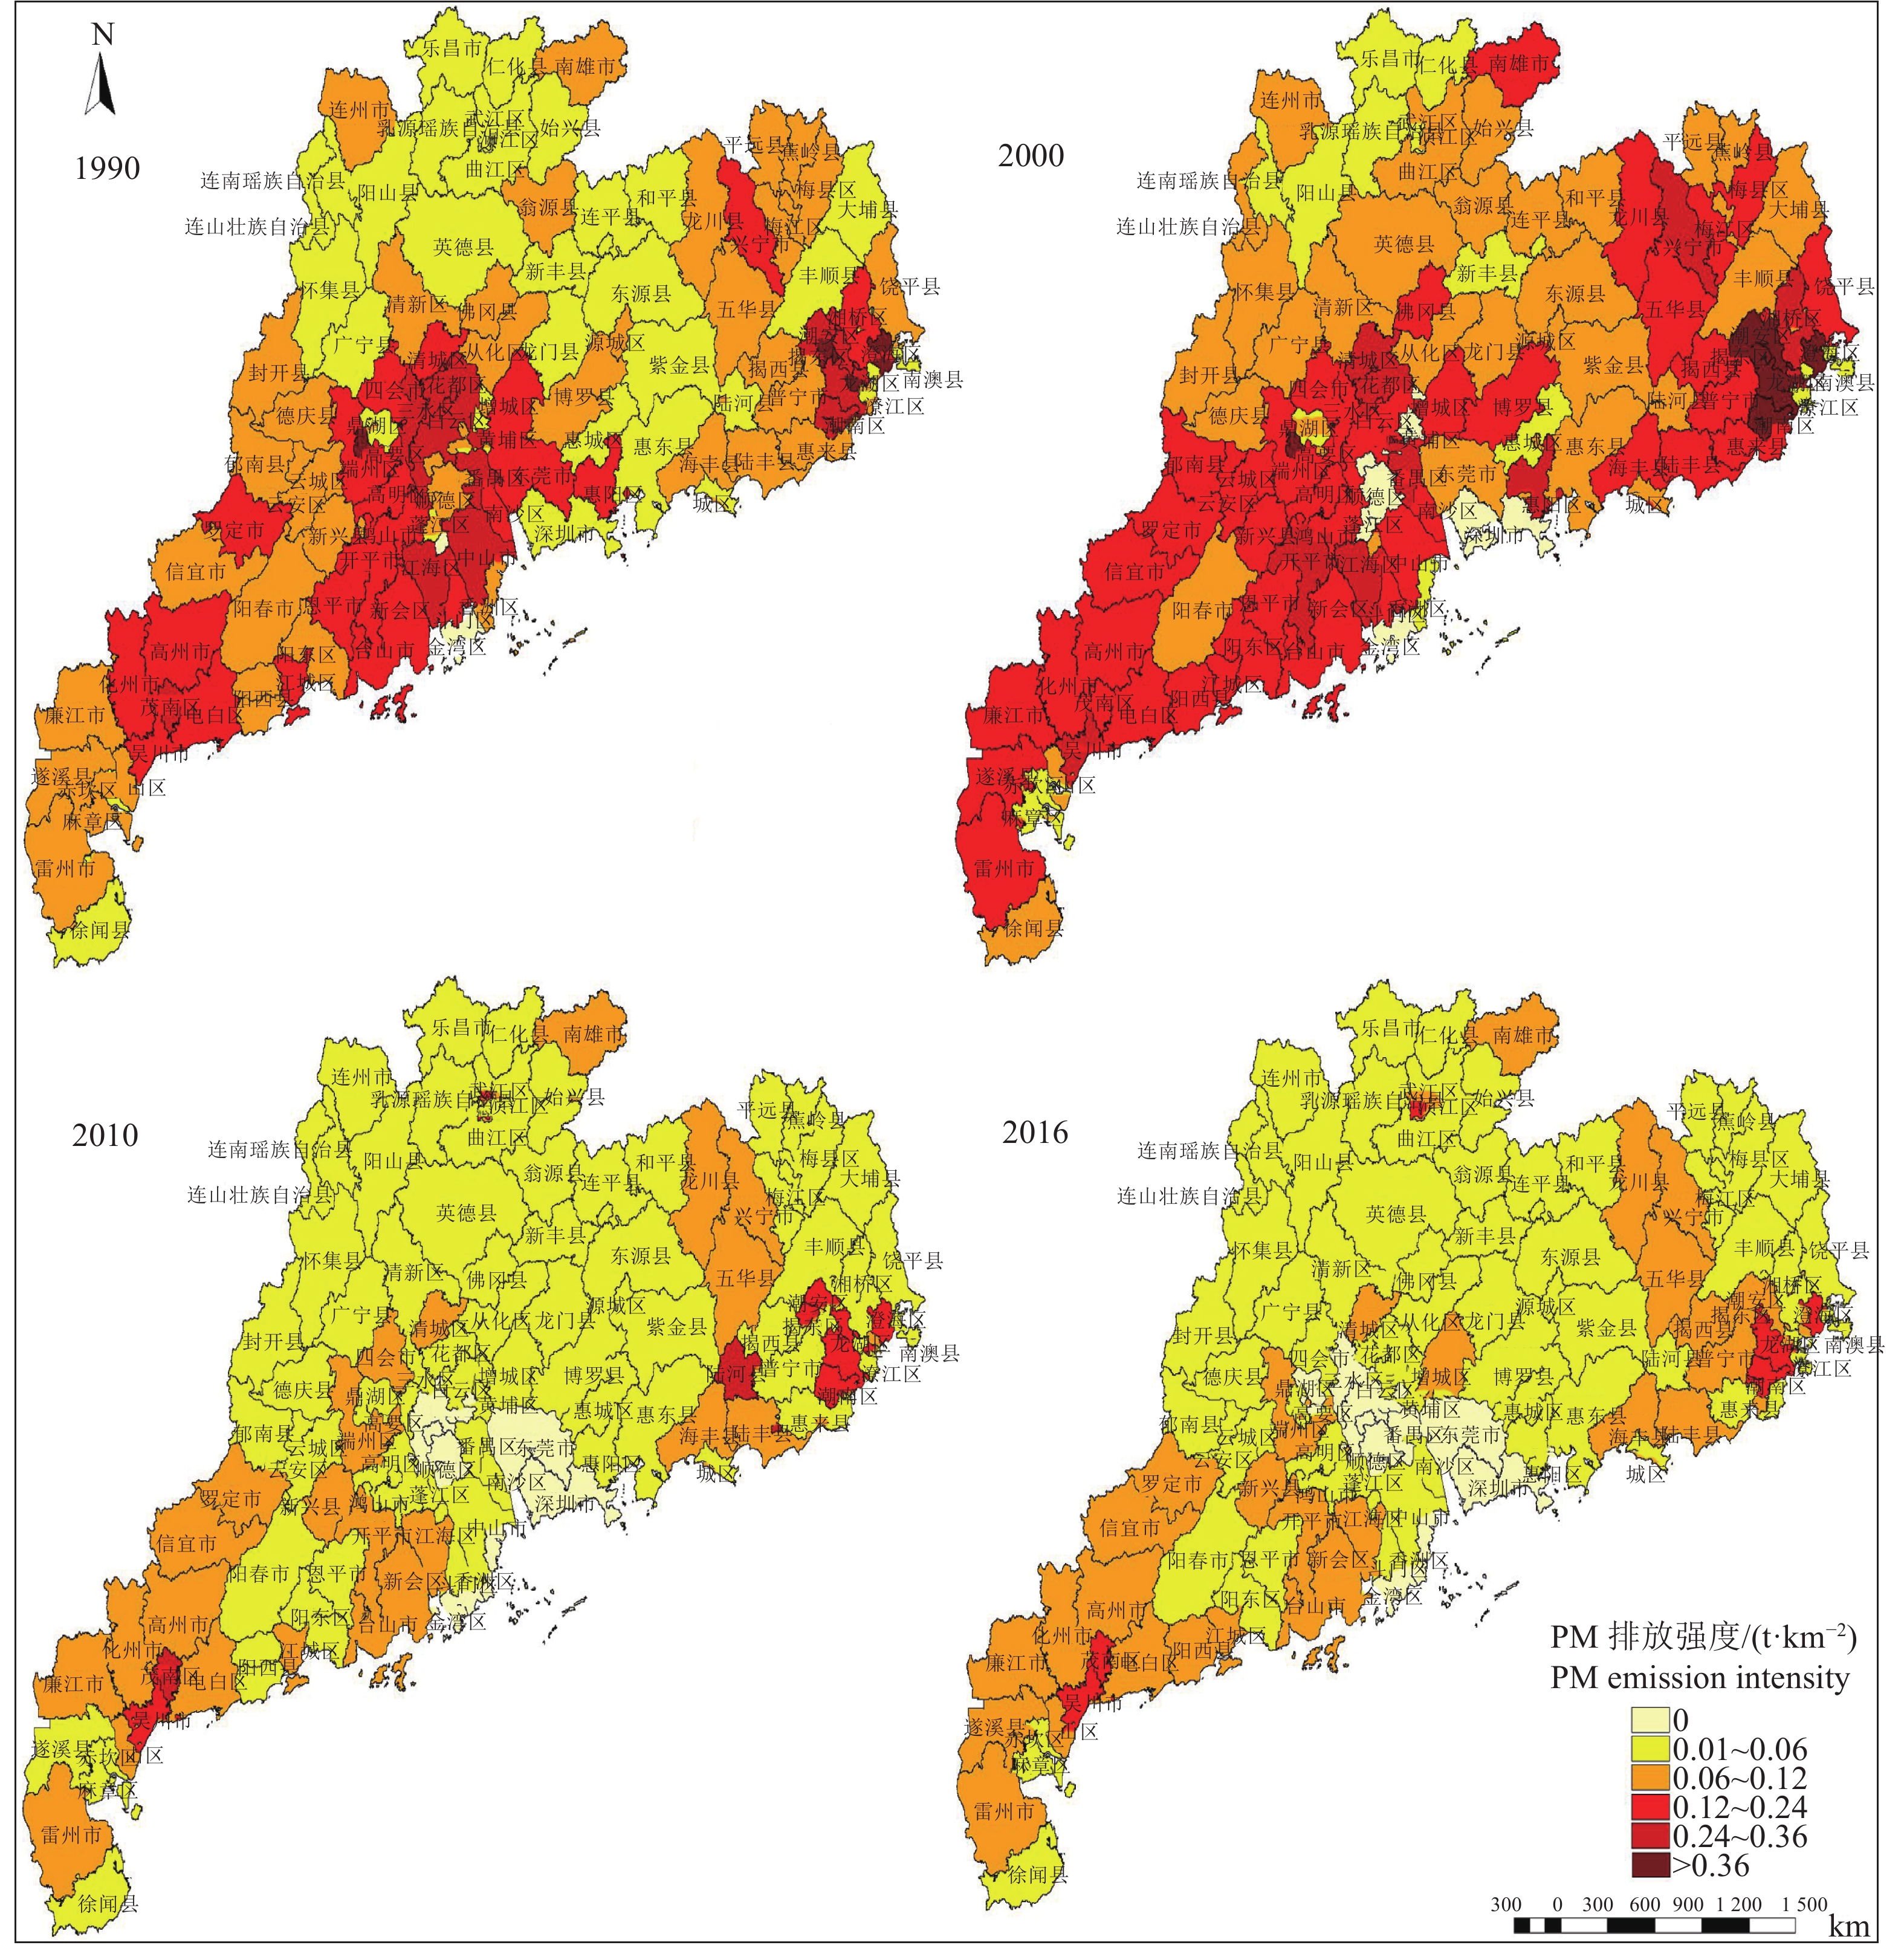
结论1990—2000年,除粤北的部分县(市、区)外,广东省大部分地区的大气污染物排放强度均较高;2010年前,大气污染物排放的高值区主要集中在湛江、茂名、阳江、肇庆、梅州、惠州、揭阳以及潮州市;2016年,排放强度高的地区仅集中在粤西和粤东地区的小部分县(市、区)。
Abstract:ObjectiveTo understand the emission of air pollutants from open burning of rice straw in Guangdong province, and provide certain reference for utilization of rice straw resources and control of air pollutant.
MethodBased on the statistical data of rice yield, the ratio of straw to grain, combustion ratio and efficiency of rice straw in Guangdong province from 1990 to 2016, we calculated rice straw yield and air pollutant emission from open burning of rice straw using the emission factor method. The temporal and spatial distribution characteristics of air pollutant emission were analyzed using the ArcGIS 10.2 software.
ResultFrom 1990 to 2016, the total amount of rice straw resources in Guangdong Province showed a trend of “decline-rise-decline-rise”, which decreased from 16.87 million tons in 1990 to 10.87 million tons in 2016 with an average annual decrease rate of 1.7%. During the period, the amounts of PM, BC, OC, SO2, NOx, NH4, CO and CO2 emissions decreased by 8 800, 200, 5 200, 1 100, 800, 2 900, 106 500 and 2 585 800 tons, respectively. Their decrease rates were 48.09%, 50.00%, 48.60%, 50.00%, 50.00%, 48.33%, 48.45% and 48.45%, respectively. The spatial distribution of total amount of pollutant emission from open burning of rice straw was unbalanced in different regions of Guangdong province. In 1990, the amounts of PM pollutant emissions were greater than 1 000 t in Maoming, Yangjiang, Zhaoqing, Guangzhou, Huizhou, Heyuan, Shanwei Jieyang and Chaozhou. In 2000, the PM pollutant emissions were above 1 000 t in most cities of Guangdong province. From 2010 to 2016, except for Jieyang, PM pollutant emissions were below 1 000 t.
ConclusionFrom 1990 to 2000, except for some counties in northern Guangdong, the pollutant emission intensity are high in most cities of Guangdong province. The high value areas of pollutant emission before 2010 are mainly concentrated in Zhanjiang, Maoming, Yangjiang, Zhaoqing, Meizhou, Huizhou, Jieyang and Chaozhou. In 2016, the high intensity of pollutant emission was only concentrated in a small number of counties in western and eastern Guangdong.
-
Keywords:
- rice straw /
- open burning /
- air pollutant /
- temporal and spatial distribution /
- Guangdong Province
-
-
![]()
图 1 广东省1990—2016年水稻秸秆产量变化
Figure 1. The change of rice straw yield in Guangdong Province from 1990 to 2016
![]()
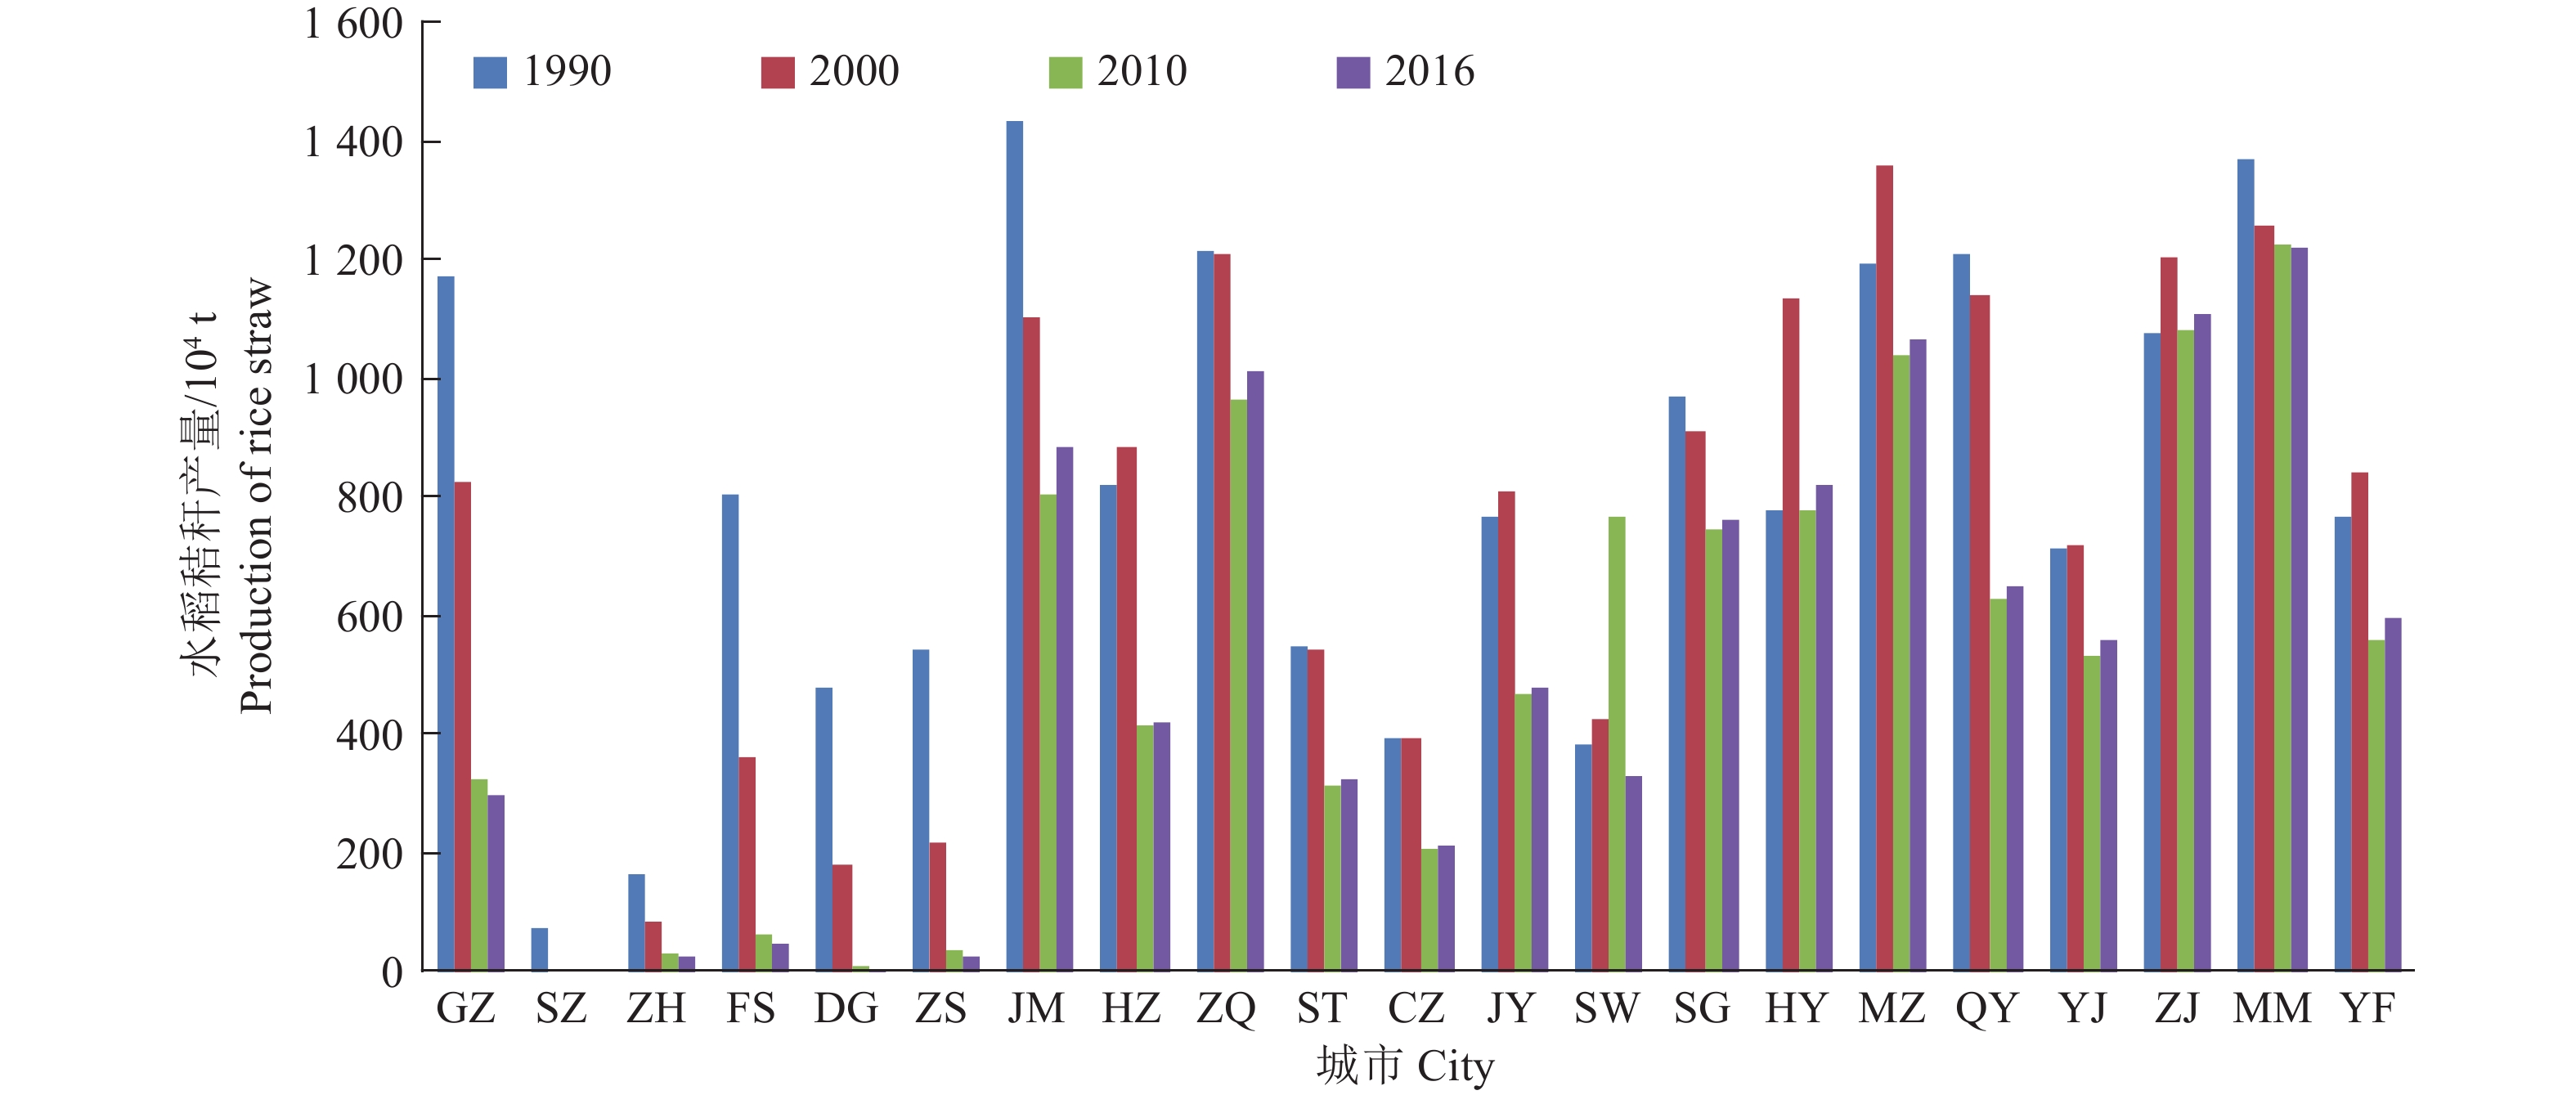
图 2 广东省各地市1990-2016年水稻秸秆产量变化趋势
GZ:广州,SZ:深圳,,ZH:珠海,FS:佛山,DG:东莞,ZS:中山,JM:江门,HZ:惠州,ZQ:肇庆,ST:汕头,CZ:潮州,JY:揭阳,SW:汕尾,SG:韶关,HY:河源,MZ:梅州,QY:清远,YJ:阳江,ZJ:湛江,MM:茂名,YF:云浮
Figure 2. The changing trend of rice straw yield in various cities of Guangdong Province from 1990 to 2016
GZ:Guangzhou,SZ:Shengzhen,ZH:Zhuhai,FS:Foshan,DG:Dongguan,ZS:Zhongshan,JM:Jiangmen,HZ:Huizhou,ZQ:Zhaoqing,ST:Shantou,CZ:Chaozhou,JY:Jieyang,SW:Shanwei,SG:Shaoguan,HY:Heyuan,MZ:Meizhou,QY:Qingyuan,YJ:Yangjiang,ZJ:Zhanjiang,MM:Maoming,YF:Yunfu
![]()
图 3 1990—2016年广东省各市水稻秸秆露天焚烧PM排放量分布
Figure 3. Distribution of PM pollutant emission from open burning of rice straw in different cities of Guangdong Province from 1990 to 2016
![]()
图 4 1990—2016年广东省各县水稻秸秆露天焚烧PM排放强度分布
Figure 4. Emission intensityof PM pollutant from open burning of rice straw in different counties of Guangdong Province from 1990 to 2016
表 1 水稻秸秆露天焚烧排放因子[18]
Table 1 Emission factors of rice straw burned in field
污染物 Pollutant PM SO2 NOx CH4 BC OC CO CO2 排放因子/( g·kg−1) Emission factor 6.04 0.147 3.52 0.72[32] 0.52 1.96 72.4 1 757.6  下载: 导出CSV
表 2 1990—2016年广东省水稻秸秆露天焚烧各污染物和CO2排放量
Table 2 Total estimated amount of pollutant and CO2 emission from open burning of rice straw in Guangdong Province from 1990 to 2016 104 t
年份 Year PM SO2 NOx CH4 BC OC CO CO2 1990 1.83 0.04 1.07 0.22 0.16 0.60 21.98 533.71 1991 1.80 0.04 1.05 0.21 0.15 0.58 21.52 522.53 1992 1.74 0.04 1.02 0.21 0.15 0.57 20.88 506.91 1993 1.55 0.04 0.90 0.18 0.13 0.50 18.58 451.08 1994 1.56 0.04 0.91 0.19 0.13 0.51 18.69 453.68 1995 1.69 0.04 0.98 0.20 0.15 0.55 20.25 491.60 1996 1.77 0.04 1.03 0.21 0.15 0.57 21.19 514.51 1997 1.81 0.04 1.06 0.22 0.16 0.59 21.75 528.12 1998 1.84 0.04 1.07 0.22 0.16 0.60 22.00 534.20 1999 1.77 0.04 1.03 0.21 0.15 0.58 21.24 515.72 2000 2.44 0.06 1.42 0.29 0.21 0.79 29.22 709.25 2001 2.30 0.06 1.34 0.27 0.20 0.75 27.55 668.80 2002 1.98 0.05 1.16 0.24 0.17 0.64 23.77 576.97 2003 1.99 0.05 1.16 0.24 0.17 0.65 23.90 580.18 2004 1.79 0.04 1.04 0.21 0.15 0.58 21.47 521.14 2005 1.78 0.04 1.04 0.21 0.15 0.58 21.35 518.29 2006 1.62 0.04 0.94 0.19 0.14 0.53 19.42 471.38 2007 1.67 0.04 0.97 0.20 0.14 0.54 19.99 485.37 2008 1.60 0.04 0.93 0.19 0.14 0.52 19.18 465.54 2009 1.69 0.04 0.98 0.20 0.15 0.55 20.22 490.97 2010 0.92 0.02 0.54 0.11 0.08 0.30 11.06 268.43 2011 0.95 0.02 0.56 0.11 0.08 0.31 11.44 277.62 2012 0.95 0.02 0.56 0.11 0.08 0.31 11.44 277.62 2013 0.95 0.02 0.56 0.11 0.08 0.31 11.44 277.62 2014 0.95 0.02 0.55 0.11 0.08 0.31 11.38 276.29 2015 0.95 0.02 0.55 0.11 0.08 0.31 11.35 275.47 2016 0.95 0.02 0.55 0.11 0.08 0.31 11.33 275.13 减少量1) 0.88 0.02 0.52 0.11 0.08 0.29 10.65 258.58 减少率/%2) 48.09 50.00 48.60 50.00 50.00 48.33 48.45 48.45 1) 减少量=1990年的值−2016年的值;2) 减少率= (1990年的值−2016年的值)/1990年的值×100%
1) Reduction=Value in 2016 − Value in 1990; 2) Reduction rate=(Value in 1990 − Value in 2016)/Value in 1990 ×100%
下载: 导出CSV
-
[1] 陈璐, 帅正彬, 姚雅韦, 等. 秸秆原料综合利用的研究进展[J]. 四川农业科技, 2015(12): 37-43. doi: 10.3969/j.issn.1004-1028.2015.12.016 [2] 董靖华. 怀集县水稻秸秆焚烧的现状分析和处理方法探讨[J]. 南方农机, 2018(6): 200-215. doi: 10.3969/j.issn.1672-3872.2018.06.174 [3] 孙晶晶.国内外秸秆综合利用现状[EB/OL]. (2015-4-28)[2018-08-10].http://news.nongji360.com/html/2015/04/202825.shtml. [4] 朱建春, 李荣华, 杨香云, 等. 近30年来中国农作物秸秆资源量的时空分布[J]. 西北农林科技大学学报(自然科学版), 2012, 40(4): 139-145. [5] 付乐, 王姗姗, 武志立, 等. 河南省秸秆露天焚烧大气污染物排放量的估算与分析[J]. 农业环境科学学报, 2017, 36(4): 808-816. [6] 王书肖, 张楚莹. 中国秸秆露天焚烧大气污染物排放时空分布[J]. 中国科技论文在线, 2008, 3(5): 329-333. doi: 10.3969/j.issn.2095-2783.2008.05.005 [7] 李炜, 张红. 山西省农田秸秆露天焚烧碳释放量估算[J]. 中国农学通报, 2013, 29(26): 118-120. doi: 10.11924/j.issn.1000-6850.2013-1175 [8] 王雨辰, 陈浮, 朱伟, 等. 江苏省秸秆资源量估算及其区域分布研究[J]. 江苏农业科学, 2013, 41(6): 305-310. doi: 10.3969/j.issn.1002-1302.2013.06.111 [9] 方放, 李想, 石祖梁, 等. 黄淮海地区农作物秸秆资源分布及利用结构分析[J]. 农业工程学报, 2015, 31(2): 228-234. doi: 10.3969/j.issn.1002-6819.2015.02.032 [10] 郭冬生, 黄春红. 近10年来中国农作物秸秆资源量的时空分布与利用模式[J]. 西南农业学报, 2016, 29(4): 948-954. [11] 李继福, 付国星, 梅青青, 等. 湖北省主要农作物秸秆资源分布特征及还田现状[J]. 长江大学学报(自科版), 2016, 13(21): 47-51. doi: 10.3969/j.issn.1673-1409(s).2016.21.012 [12] 朱丽君, 王光宇, 张耀兰. 长三角地区农作物秸秆资源量的时空分布特点[J]. 贵州农业科学, 2017, 45(4): 138-142. doi: 10.3969/j.issn.1001-3601.2017.04.034 [13] 曹国良, 张小曳, 龚山陵, 等. 中国区域主要颗粒物及污染气体的排放源清单[J]. 科学通报, 2011, 56(3): 261-268. [14] 苏继峰, 朱彬, 康汉青, 等. 长江三角洲地区秸秆露天焚烧大气污染物排放清单及其在空气质量模式中的应用[J]. 环境科学, 2012, 33(5): 1418-1424. [15] 叶延琼, 李韵, 章家恩, 等. GIS支持下的广东省水稻种植生态适宜性评价[J]. 湖南农业大学学报(自然科学版), 2013, 39(2): 131-136. [16] 韩鲁佳, 闫巧娟, 刘向阳, 等. 中国农作物秸秆资源及其利用现状[J]. 农业工程学报, 2002, 18(3): 87-91. doi: 10.3321/j.issn:1002-6819.2002.03.022 [17] 毕于运, 王亚静, 高春雨, 等. 中国主要秸秆资源数量及其区域分布[J]. 农机化研究, 2010(3): 1-7. doi: 10.3969/j.issn.1003-188X.2010.03.001 [18] 曹国良, 张小曳, 郑方成, 等. 中国区域农田秸秆露天焚烧排放量的估算[J]. 科学通报, 2007, 52(15): 1826-1831. doi: 10.3321/j.issn:0023-074x.2007.15.017 [19] 谢光辉, 韩东倩, 王晓玉. 中国禾谷类大田作物收获指数和秸秆系数[J]. 中国农业大学学报, 2011, 16(1): 1-8. [20] 樊驰, 胡健, 李明. 南充市主要农作物秸秆露天焚烧大气污染物产生量[J]. 四川环境, 2017, 36(增刊): 47-50. [21] HAO W M, LIU M H. Spatial and temporal distribution of tropical biomass burning[J]. Global Biogeochem Cycles, 1994, 8(8): 495-503.
[22] 曹国良, 张小曳, 王丹, 等. 中国大陆生物质焚烧排放的污染物清单[J]. 中国环境科学, 2005, 25(4): 389-393. doi: 10.3321/j.issn:1000-6923.2005.04.002 [23] 曹国良, 张小曳, 王丹, 等. 秸秆露天焚烧排放的TSP 等污染物清单[J]. 农业环境科学学报, 2005, 24(4): 800-804. doi: 10.3321/j.issn:1672-2043.2005.04.041 [24] 林日强, 宋丹丽. 广东省作物秸秆的利用现状与问题[J]. 土壤与环境, 2002, 11(1): 110. doi: 10.3969/j.issn.1674-5906.2002.01.028 [25] 高利伟, 马林, 张卫峰, 等. 中国作物秸秆养分资源数量估算及其利用状况[J]. 农业工程学报, 2009, 25(7): 173-179. doi: 10.3969/j.issn.1002-6819.2009.07.032 [26] 彭立群, 张强, 贺克斌. 基于调查的中国秸秆露天焚烧污染物排放清单[J]. 环境科学研究, 2016, 29(8): 1109-1118. [27] 中华人民共和国国家发展和改革委员会. 中国资源综合利用年度报告(2012 年)[R/OL].(2013-04-08)[2018-08-10].http://www.Gov.cn/gzdt/2013-04/08/content_2372577.htm. [28] 中华人民共和国国家发展和改革委员会. 中国资源综合利用年度报告(2014年)[R/OL]. (2014-10-09)[2018-08-10].http://www.sdpc.gov.cn/xwzx/xwfb/201410/t20141009_628793.html. [29] 中华人民共和国国家发展和改革委员会. 关于全国秸秆综合利用和焚烧情况的通报(发改办环资[2014]516号)[R/OL]. (2014-03-11)[2018-08-11]. http://www.ndrc.gov.cn/zcfb/zcfbtz/201403/t20140317_602802.html. [30] STREETS D G, YARBER K F, WOO J, et al. Biomass burning in Asia: Annual and seasonal estimates and atmospheric emissions[J]. Global Biogeochem Cycles, 2003, 17(4): 1099-1119.
[31] DE ZÁRATE I O, EZURRA A, LACAUX J P, et al. Pollution by cereal waste burning in Spain[J]. Atmospheric Res, 2005, 73(1/2): 161-170.
[32] JENKINS B M, TURN S Q, WILLIAMS R B, et al. Atmospheric pollutant emission factors from open burning of agricultural and forest biomass by wind tunnel simulations[J]. Optics Express, 1996, 18(23): 24344-51.
[33] 崔岩山, 王庆仁. 土壤与大气环境中硫行为及其对植物的影响[J]. 中国生态农业学报, 2002, 10(3): 84-86. [34] 唐喜斌, 黄成, 楼晟荣, 等. 长三角地区秸秆燃烧排放因子与颗粒物成分谱研究[J]. 环境科学, 2014, 35(5): 1623-1632. [35] 杭维琦, 陈建江. 野外燃烧秸秆对环境质量的影响与防治[J]. 环境监测管理与技术, 2000(2): 36-37. [36] STREETS D G, GUPTA S, WALDHOFF S T, et al. Black carbon emissions in China[J]. Atmos Environ, 2001, 35(25): 4281-4296. doi: 10.1016/S1352-2310(01)00179-0
[37] DUAN F, LIU X, YU T, et al. Identification and estimate of biomass burning contribution to the urban aerosol organic carbon concentrations in Beijing[J]. Atmos Environ, 2004, 38(9): 1275-1282. doi: 10.1016/j.atmosenv.2003.11.037
[38] IPCC. Greenhouse Gas Inventory, reference manual[M]. Bracknell, UK: IPCC, 1996.
[39] 广东省环境保护厅.环境状况公报[EB/OL]. (2018-06-04)[2018-09-10]. http://www.gdep.gov.cn/hjjce/gb/. [40] 郑有飞, 田宏伟, 陈怀亮, 等. 河南省夏季秸秆焚烧污染物排放量的估算与分析[J]. 农业环境科学学报, 2010, 29(8): 1590-1594.