Detection of polysaccharide content in Pleurotus eryngii based on spectral and image information
-
摘要:目的
利用高光谱成像技术实现杏鲍菇Pleurotus eryngii多糖含量的快速无损检测。
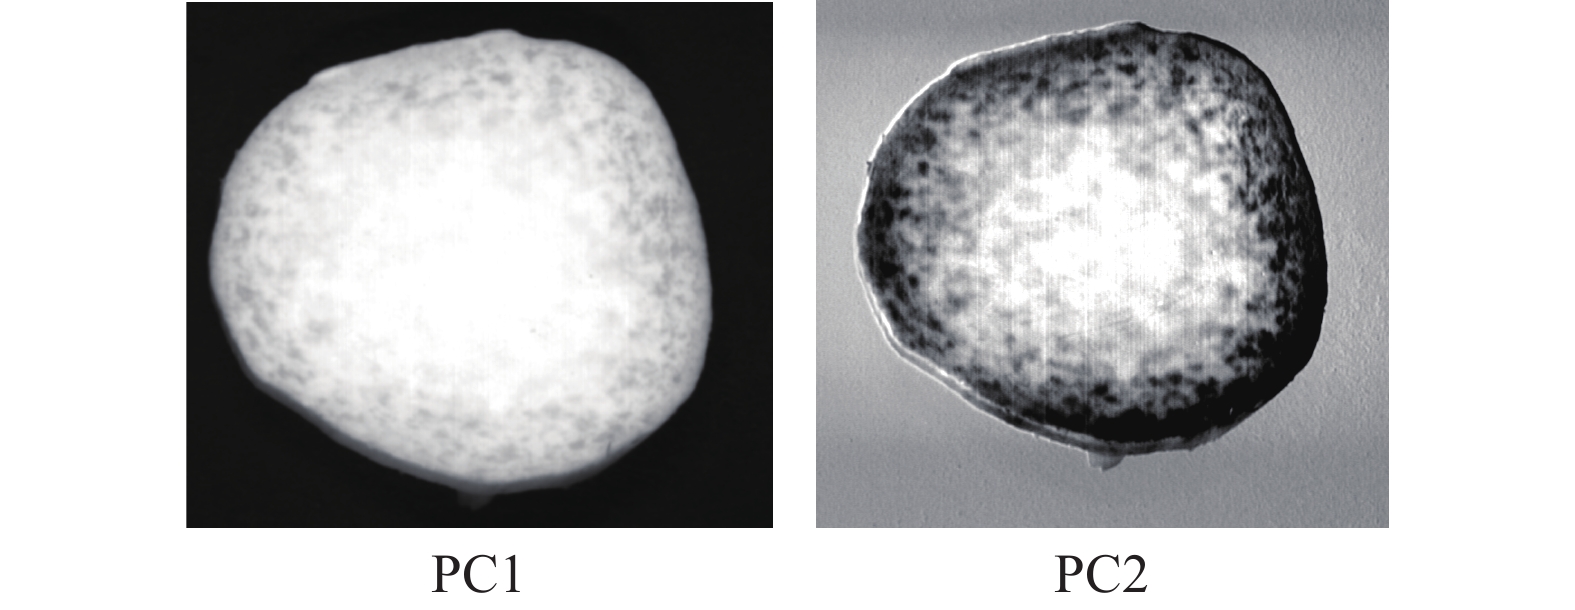
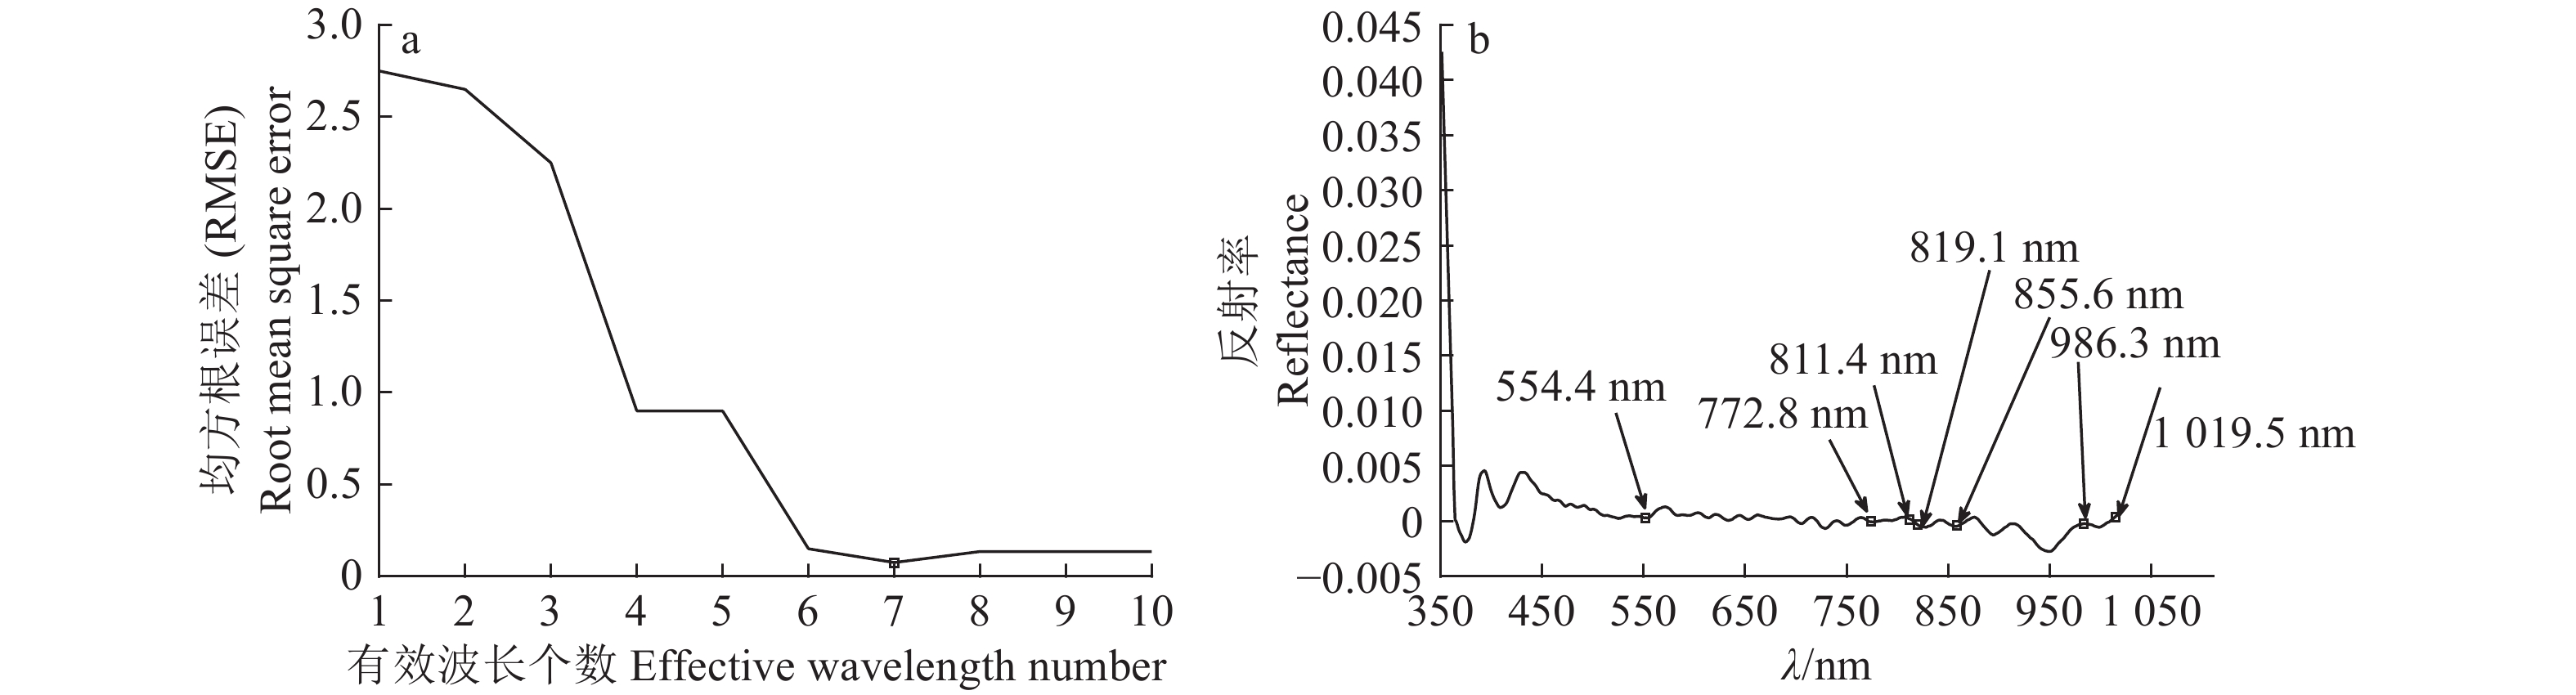
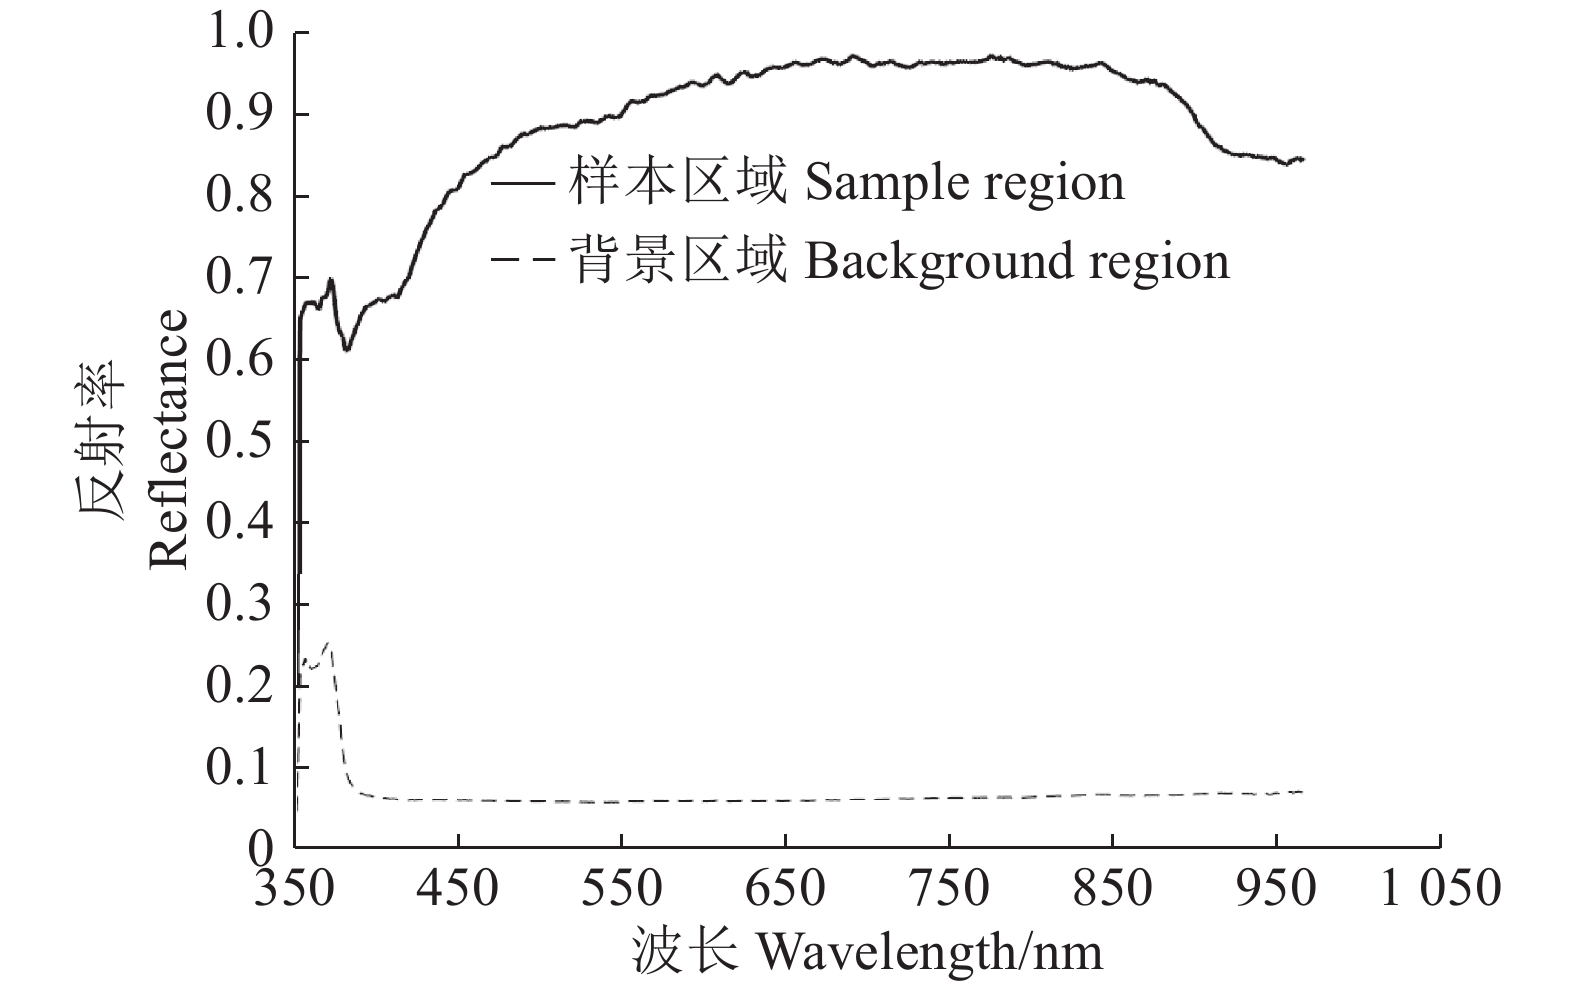
方法利用高光谱图像采集系统获取350~1 021 nm波长范围内的杏鲍菇高光谱图像,同时利用苯酚–硫酸法测定对应样本的多糖含量。通过波段运算和阈值分割构建掩膜图像,使样本与背景相分离。采用主成分分析(PCA)处理原始高光谱图像,获得代表原始图像99%信息的2个主成分图像(PC1、PC2),然后利用连续投影算法(SPA)选出554.4、772.8、811.4、819.1、855.6、986.3和1 019.5 nm 7个特征波长及对应的光谱特征,分别提取7个特征波长图像和2个主成分图像的纹理与颜色特征,最后利用偏最小二乘回归(PLSR)建立杏鲍菇样本基于不同图像特征与多糖含量之间的关系模型。
结果从校正集决定系数(Rc2)来看,基于特征光谱+特征波长图像特征+主成分图像特征的模型效果最好,Rc2=0.954,RMSEc=0.341;从预测集决定系数Rp2来看,基于特征光谱+特征波长图像特征的模型效果最好,Rp2=0.868,RMSEP=0.539。
结论该研究结果可为杏鲍菇多糖含量的快速、无损检测提供一定的参考。
Abstract:ObjectiveTo quickly and non-destructively detect polysaccharide content in Pleurotus eryngii using hyperspectral imaging technology.
MethodHyperspectral images of P. eryngii in the visible and near infrared (390-1050 nm) regions were acquired using the hyperspectral imaging system. Polysaccharide contents in corresponding P. eryngii samples were measured by phenol sulfuric acid method. The binary mask image was constructed by the method of band operation and threshold segmentation to separate the sample area from the background area. Principal component analysis (PCA) was used to process the original hyperspectral images, and two principal component images (PC1, PC2) representing 99% information of the original image were obtained. Seven characteristic wavelengths of 554.4, 772.8, 811.4, 819.1, 855.6, 986.3, and 1 019.5 nm were selected using the successive projection algorithm (SPA). Texture and color data were extracted from two principal component images and seven characteristic wavelength images, and spectral data were also extracted from seven characteristic wavelength images. Using partial least squares regression (PLSR) models were established based on the correlations of different image features and polysaccharide contents in P. eryngii samples
ResultAccording to the determination coefficient of the calibration set (Rc2), the best model is the one based on characteristic spectra, characteristic wavelength images and principal component images with Rc2=0.954 and RMSEC=0.341. According to the determination coefficient of the prediction set (Rp2), the best model is the one based on characteristic spectra and characteristic wavelength images with Rp2=0.868 and RMSEP=0.539.
ConclusionThis study provides references for fast and non-destructive detection of polysaccharide content in Pleurotus eryngii.
-
![]()
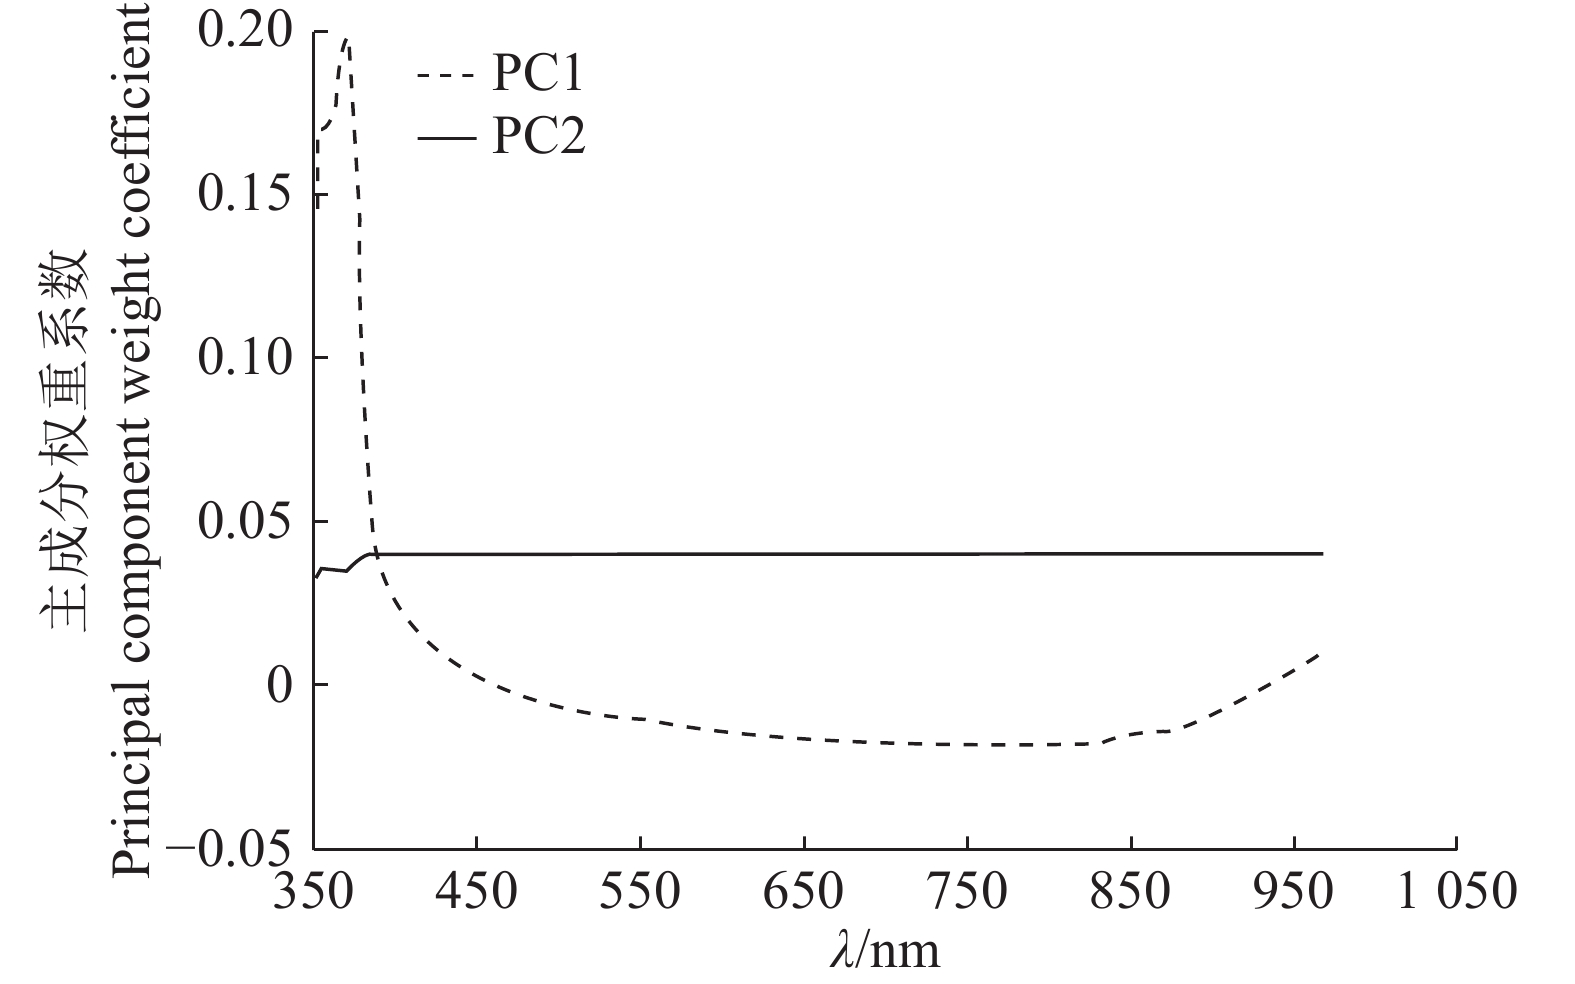
图 2 前2个主成分图像下各波段的平均权重系数
Figure 2. The average weight coefficient of each band in images of the first two principal components
![]()
图 3 SPA优选特征波长过程
a:均方根误差随变量个数的变化;b:SPA优选特征波长分布图
Figure 3. Process of selecting characteristic wavelength based on SPA
a: Variation of root mean square error with the number of variables; b: Distribution map of SPA characteristic wavelength
![]()
图 4 样本区域与背景区域的光谱曲线
Figure 4. Spectral curves of the sample region and the background region
![]()
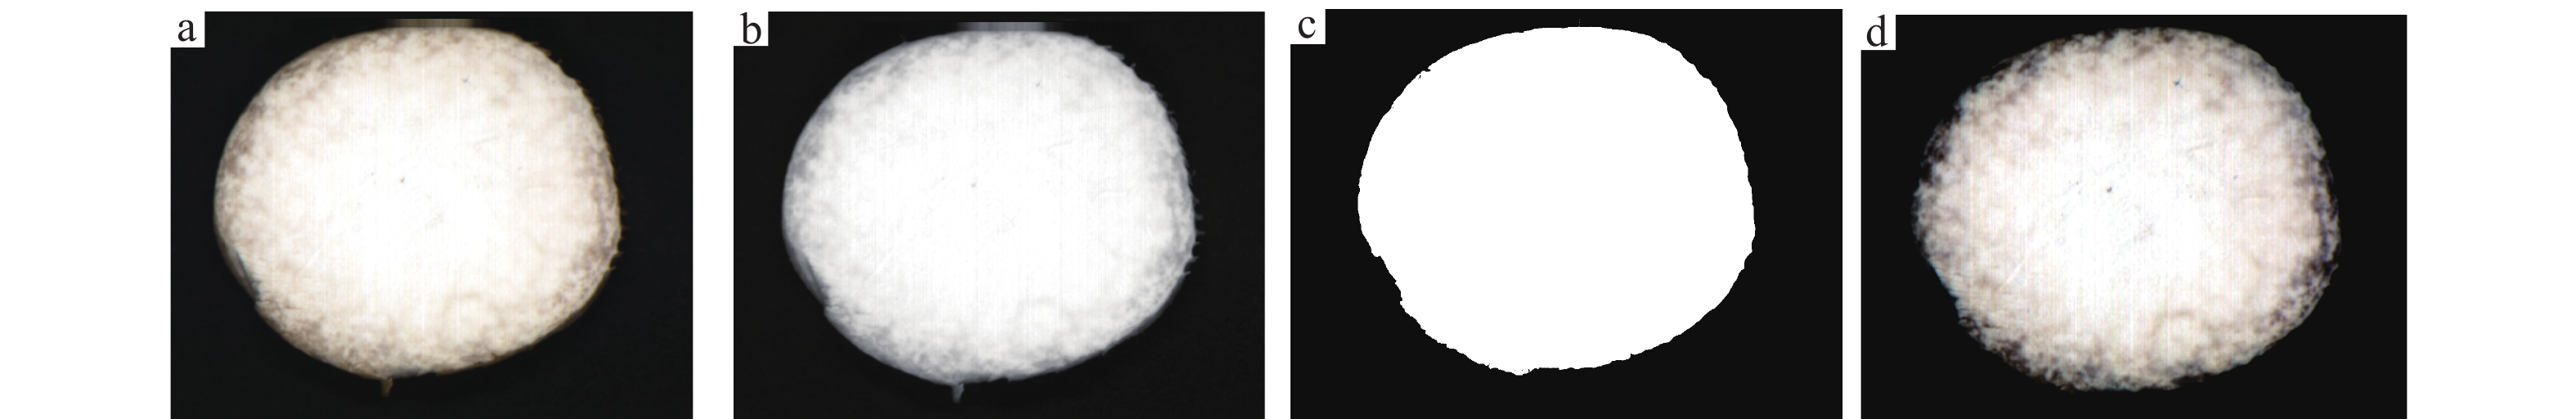
图 5 图像分割流程
a:原始高光谱图像;b:750 nm处图像;c:二值掩膜图像;d:掩膜处理后的高光谱图像
Figure 5. Process of image segmentation
a: Original hyperspectral image; b: Image of 750 nm; c: Image with binary mask; d: Hyperspectral image after masking
表 1 校正集与预测集样本多糖含量的统计结果
Table 1 Statistical results of polysaccharide contents in calibration set and predication set
样本集
Sample setn w(多糖)/(g·kg−1)
Polysaccharide content最大值 Maximum 最小值 Minimum 平均值 Average 校正集 Calibration set 132 64.2 23.6 43.2 预测集 Prediction set 88 58.1 31.5 40.2  下载: 导出CSV
表 2 基于不同特征的模型对多糖含量的预测性能比较
Table 2 Comparison of prediction performance of polysaccharide content based on different characteristics
模型1)
Model校正集 Calibration set 预测集 Prediction set Rc2 RMSEc Rp2 RMSEP 1 0.876 0.511 0.833 0.632 2 0.778 0.721 0.738 0.778 3 0.732 0.782 0.628 0.933 4 0.821 0.650 0.772 0.714 5 0.912 0.451 0.868 0.539 6 0.855 0.546 0.757 0.767 7 0.954 0.341 0.815 0.661 1) 1:基于特征光谱模型;2:基于特征波长图像特征模型;3:基于主成分图像特征模型;4:基于特征波长图像特征+主成分图像特征模型;5:基于特征光谱+特征波长图像特征模型;6:基于特征光谱+主成分图像特征模型;7:基于特征光谱+特征波长图像特征+主成分图像特征模型
1) 1: Model based on characteristic spectra; 2: Model based on feature of characteristic wavelength images; 3: Model based on feature of principal component images; 4: Model based on features of characteristic wavelength images and principal component images; 5: Model based on characteristic spectra and feature of characteristic wavelength images; 6: Model based on characteristic spectra and feature of principal component images; 7: Model based on characteristic spectra and features of characteristic wavelength images and principal component images
下载: 导出CSV
表 3 不同角度下特征波长图像和主成分图像的纹理特征与多糖含量的相关性
Table 3 Correlation between polysaccharide content and texture parameters of characteristic wavelength image and principal component image at different angles
项目
Itemλ/nm
或主成分
or PC对比度
Contrast能量
Energy同质性
Homogeneity相关性
Correlation0 45° 90° 135° 0 45° 90° 135° 0 45° 90° 135° 0 45° 90° 135° 特征波长图像
Characteristic wavelength image554.4 –0.7 –0.7 –0.8 –0.8 0.6 0.6 0.6 0.6 0.2 0.2 0.2 0.3 0.4 0.3 0.3 0.3 772.8 –0.6 –0.8 –0.8 –0.8 0.7 0.7 0.7 0.7 0.2 0.2 0.2 0.2 0.5 0.5 0.5 0.4 811.4 –0.7 –0.8 –0.7 –0.7 0.7 0.7 0.7 0.7 0.2 0.2 0.2 0.2 0.4 0.4 0.4 0.4 819.1 –0.7 –0.7 –0.7 –0.7 0.6 0.7 0.6 0.7 0.3 0.3 0.2 0.2 0.4 0.4 0.5 0.4 855.6 –0.8 –0.7 –0.7 –0.7 0.7 0.7 0.6 0.6 0.3 0.2 0.3 0.2 0.3 0.4 0.4 0.4 986.3 –0.7 –0.7 –0.7 –0.8 0.6 0.6 0.6 0.6 0.2 0.2 0.2 0.2 0.5 0.5 0.4 0.4 1 019.5 –0.7 –0.6 –0.6 –0.6 0.7 0.7 0.6 0.6 0.3 0.3 0.3 0.3 0.4 0.5 0.4 0.5 主成分图像
Principal component imagePC1 –0.7 –0.8 –0.8 –0.7 0.6 0.6 0.6 0.6 0.3 0.4 0.4 0.4 0.5 0.4 0.5 0.5 PC2 –0.4 –0.5 –0.5 –0.4 0.5 0.4 0.4 0.4 0.2 0.2 0.2 0.2 0.3 0.3 0.4 0.3
下载: 导出CSV
-
[1] 李月梅, 采俊香, 牛瑞青. 不同基质配方工厂化栽培杏鲍菇研究[J]. 北方园艺, 2012(7): 177-179. [2] MARIGA A M, PEI F, YANG W J, et al. Immunopotentiation of Pleurotus eryngii (DC. ex Fr.) Quel.[J]. J Ethnopharmacol, 2014, 153(3): 604-614. doi: 10.1016/j.jep.2014.03.006
[3] ZHANG A, LI X, XING C, et al. Antioxidant activity of polysaccharide extracted from Pleurotus eryngii using response surface methodology.[J]. Int J Biol Macromol, 2014, 65(5): 28-32.
[4] 郑素玲, 郭立英, 范永山. 杏鲍菇多糖对老龄小鼠抗疲劳能力的影响[J]. 食品科学, 2010, 31(7): 269-271. [5] 姚秋萍, 杨琼, 卫亚丽, 等. 杏鲍菇多糖研究进展[J]. 食品工业科技, 2017, 38(21): 347-351. [6] M. ELMASRY G, NAKAUCHI S. Image analysis operations applied to hyperspectral images for non-invasive sensing of food quality: A comprehensive review[J]. Biosyst Eng, 2016, 142: 53-82. doi: 10.1016/j.biosystemseng.2015.11.009
[7] 李江波, 饶秀勤, 应义斌. 农产品外部品质无损检测中高光谱成像技术的应用研究进展[J]. 光谱学与光谱分析, 2011, 31(8): 2021-2026. doi: 10.3964/j.issn.1000-0593(2011)08-2021-06 [8] 高俊峰, 张初, 谢传奇, 等. 应用近红外高光谱成像技术预测甘蔗可溶性固形物含量[J]. 光谱学与光谱分析, 2015, 35(8): 2154-2158. doi: 10.3964/j.issn.1000-0593(2015)08-2154-05 [9] ZHANG B H, HUANG W Q, LI J B, et al. Principles, developments and applications of computer vision for external quality inspection of fruits and vegetables: A review[J]. Food Res Int, 2014, 62(62): 326-343.
[10] 梁琨, 刘全祥, 潘磊庆, 等. 基于高光谱和CARS-IRIV算法的‘库尔勒香梨’可溶性固形物含量检测[J]. 南京农业大学学报, 2018, 41(4): 760-766. [11] 李晓丽, 魏玉震, 徐劼, 等. 基于高光谱成像的茶叶中EGCG分布可视化[J]. 农业工程学报, 2018, 34(7): 180-186. [12] 孙俊, 金夏明, 毛罕平, 等. 基于高光谱图像光谱与纹理信息的生菜氮素含量检测[J]. 农业工程学报, 2014, 30(10): 167-173. doi: 10.3969/j.issn.1002-6819.2014.10.021 [13] 于慧春, 王润博, 殷勇, 等. 基于高光谱图像光谱与纹理信息的枸杞多糖及总糖含量检测[J]. 核农学报, 2018, 32(3): 523-531. [14] 何勇, 彭继宇, 刘飞, 等. 基于光谱和成像技术的作物养分生理信息快速检测研究进展[J]. 农业工程学报, 2015, 31(3): 174-189. doi: 10.3969/j.issn.1002-6819.2015.03.024 [15] KAMRUZZAMAN M, SUN D W, EIMASRY G, et al. Fast detection and visualization of minced lamb meat adulteration using NIR hyperspectral imaging and multivariate image analysis[J]. Talanta, 2013(103): 130-136.
[16] YE S F, WANG D, MIN S G. Successive projections algorithm combined with uninformative variable elimination for spectral variable selection[J]. Chemometrics Intell Lab Syst, 2008, 91(2): 194-199. doi: 10.1016/j.chemolab.2007.11.005
[17] 尼珍, 胡昌勤, 冯芳. 近红外光谱分析中光谱预处理方法的作用及其发展[J]. 药物分析杂志, 2008, 28(5): 824-829. [18] 程长阔, 杨鹏程, 李燕, 等. 光谱预处理方法对硝酸盐测量模型影响实验研究及软件设计[J]. 海洋技术学报, 2015, 34(2): 69-73. [19] 张丽, 彭小列, 张建锋, 等. 杏鲍菇多糖的提取及其抑菌作用[J]. 贵州农业科学, 2010, 38(9): 90-92. doi: 10.3969/j.issn.1001-3601.2010.09.029 [20] 王瑞君. 枸杞多糖对德氏乳酸杆菌在体外生长与保存活力的影响[J]. 河北科技大学学报, 2012, 33(2): 115-118. [21] 于雷, 洪永胜, 耿雷, 等. 基于偏最小二乘回归的土壤有机质含量高光谱估算[J]. 农业工程学报, 2015, 31(14): 103-109. doi: 10.11975/j.issn.1002-6819.2015.14.015 [22] 潘国锋. 基于K-S算法的水质硝酸盐含量光谱检测方法研究[J]. 光谱实验室, 2011, 28(5): 2700-2704. doi: 10.3969/j.issn.1004-8138.2011.05.132 [23] 何嘉琳, 乔春燕, 李冬冬, 等. 可见-近红外高光谱成像技术对灵武长枣VC含量的无损检测方法[J]. 食品科学, 2018, 39(6): 194-199.