
A hyperspectral inversion model for predicting chlorophyll content of Longan leaves based on deep learning
-
摘要:目的
探讨龙眼Dimocarpus longan Lour. 叶片发育过程中叶绿素含量二维分布变化规律,实现无损检测病虫害对叶片叶绿素含量分布的影响,为评估嫩叶抗寒能力、龙眼结果期的施肥量和老熟叶的修剪提供参考。
方法利用高光谱成像仪采集龙眼叶片在369~988 nm区间的高光谱图像,自动提取感兴趣区域,利用分光光度法测定叶片叶绿素含量。基于皮尔森相关系数(r)分析了龙眼叶片生长过程中各波段光谱响应与叶绿素含量之间相关性,建立偏最小二乘回归模型。分析了特征波段图像纹理特征与叶绿素含量相关性,将光谱特征和纹理特征结合导入深度学习中的稀疏自编码(SAE)模型预测龙眼叶片叶绿素含量,结合“图谱信息”的SAE模型预测龙眼叶片叶绿素含量的分布情况。
结果龙眼叶片3个生长发育期相关系数的曲线均在700 nm附近出现波峰,嫩叶、成熟叶和老熟叶3个阶段相关性最高的波长分别为692、698 和705 nm;全发育期的最敏感波段相关性远高于3个生长发育期,r达到0.890 3。回归模型中,吸收带最小反射率位置和吸收带反射率总和建立的最小二乘回归模型预测效果最好(R2c=0.856 8,RMSEc=0.219 5;R2v=0.771 2,RMSEv=0.286 2),其校正集和验证集的决定系数均高于单一参数建立的预测模型。在所有预测模型中,结合“图谱信息”的SAE模型预测效果最好(R2c=0.979 6,RMSEc=0.171 2;R2v=0.911 2,RMSEv=0.211 5),且预测性能受叶片成熟度影响相对较小,3个生长阶段R2v的标准偏差仅为最小二乘回归模型标准偏差的29.9%。
结论提出了一种自动提取感兴趣区域的方法,成功率为100%。基于光谱特征的回归模型对不同生长阶段的叶片预测效果变化较大,而基于“图谱信息”融合的SAE模型预测性能受叶片成熟度影响相对较小且预测精度较高,SAE模型适用于不同成熟度的龙眼叶片叶绿素含量分布预测。
Abstract:ObjectiveTo study the distribution of chlorophyll content of Longan (Dimocarpus longan Lour) leaves in different growth periods, realize non-destructive measurement of the influence of pests and diseases on chlorophyll distribution, and provide a reference for evaluating the cold-resistant ability of young leaves, fertilizing amount in the fruiting period and pruning of mature leaves.
MethodHyperspectral images of Longan leaves in three growth periods were acquired via an online hyperspectral imaging system within the spectral region of 369–988 nm wavelength. An automatic masking method was used to extract the interest regions. The chlorophyll content was measured by the spectrophotometric method. The relationships between the spectral response characteristics and chlorophyll contents of Longan leaves in three growth periods were measured based on Pearson correlation coefficient (r). A partial least squares regression (LSR) model was established. The relationship between the texture feature of selected image and chlorophyll content was analyzed. The spectroscopy and texture features were imported to the spare auto-encoder (SAE) model in deep learning to predict the chlorophyll content of Longan leaves. The distribution of chlorophyll content was predicted using SAE model based on the mapping information.
ResultThe peaks of correlation coefficient curves of Longan leaves in three growth periods appeared in the vicinity of 700 nm. The wavelength of the highest correlation coefficient for young, mature and old ripe leaves was 692, 698 and 705 nm, respectively. The correlation coefficient (r) of the most sensitive band in full period was higher than those in three growth periods, which was up to 0.890 3. Among all regression models, the prediction effect of LSR model based on the absorption band of the minimum reflectivity and total reflectivity was the best (R2c=0.856 8, RMSEc=0.219 5; R2v=0.771 2, RMSEv=0.286 2), and the determination coefficients of its calibration and validation sets were higher than those based on a single parameter. SAE model importing spectroscopy and texture features performed the best (R2c=0.979 6, RMSEc=0.171 2; R2v=0.911 2, RMSEv=0.211 5) and the most stable to predict chlorophyll contents of Longan leaves in different growth periods, its standard deviation was only 29.9% of LSR model.
ConclusionA method automatically extracting interest region was proposed, its success rate was 100%. The performance of SAE model based on spectroscopy and texture features was more stable than those of regression models based on spectroscopy to predict chlorophyll contents of Longan leaves in different growth periods. SAE model is suitable for predicting the distribution of chlorophyll content of Longan leaves as a non-destructive method.
-
我国的龙眼Dimocarpus longan Lour.主要分布在海南、福建及两广等地区,对龙眼叶片叶绿素含量的高光谱检测研究深度远不及其他常见水果。叶绿素是植物进行光合作用的重要色素,其含量分布与植物营养状况密切相关,是植物氮含量的指示器[1]。传统的叶绿素含量化学检测方法主要有分光光度法、高效液相色谱法等[2-3],这些方法不仅费时费力且还要对叶片进行研磨,破坏叶片结构[4]。实际研究和应用中,也采用SPAD值来表征研究对象的叶绿素相对含量[5],但SPAD仪是点检测,无法完整反映叶片的营养状况[6]。赵艳茹等[7]采用图像处理技术得到南瓜叶片SPAD值的分布图,反映了霜霉病的感染分布,进而判断南瓜叶片的霜霉病疫情。余克强等[8]基于高光谱成像技术研究不同叶位尖椒叶片的氮素分布,发现了不同叶位尖椒叶片的氮素分布规律,为有效监测植物生长状况及养分分布提供理论依据。Cheng等[9]基于近红外高光谱检测了草鱼鱼肉的肉质情况,但其采用手工方法提取感兴趣区域,不利于实现高光谱的自动化在线检测,故本文提出一种自动提取感兴趣区域的方法。朱瑶迪等[10]采用高光谱图像技术结合联合区间偏最小二乘法分析了总酸在不同阶段的变化规律,研究了总酸在醋醅中的分布情况。李芳等[11]基于近红外高光谱研究了银杏叶中黄酮含量的叶面分布检测方法,为揭示黄酮含量在银杏叶中的分布规律提供了技术手段。Jin等[12]利用偏最小二乘法和高光谱技术准确检测出花生仁中水分分布情况。由此可见,基于高光谱成像技术检测物质含量的分布情况是可行的。但这些物质分布预测均基于光谱信息,未涉及高光谱图像信息,故本研究尝试结合“图谱信息”进行叶绿素含量分布预测。
龙眼小苗定植后处于幼龄期,这个时期重点监测嫩叶的营养状况,嫩叶叶绿体小,其净光合作用有机产物往往只够满足自身需要,因此抗寒能力弱,需要掌握嫩叶叶绿素含量分布状况评估其抗寒能力,提高小苗存活率;进入稳定生长的龙眼树主要以成熟叶为主进行光合作用为果实发育提供有机物,根据叶片叶绿素含量分布情况合理地施加氮肥可以减轻果实发育与夏梢生长争夺养分的矛盾;老熟叶维管束组织部分遭破坏,所含叶绿体开始分解,所以老熟叶抗旱能力和光合作用较弱,故需要掌握老熟叶的叶绿素分布情况以评估其是否需要修剪,以减少老熟叶对树体养分的消耗[13-16]。当前关于叶绿素含量的高光谱反演中,对反演模型的评价往往是基于不同成熟度叶片组合而成的验证集进行综合评价,鲜有针对不同成熟度叶片的叶绿素含量预测性能稳定性的研究。本试验将龙眼叶片分为嫩叶、成熟叶和老熟叶3个批次进行叶绿素含量分布的反演,为更好地监测龙眼叶片生长状况及养分分布提供理论依据。
1. 材料与方法
1.1 样本采集与处理方法
龙眼果实发育期正是植株水肥需求量最大时期,试验采集的叶片样本来自20株结果期的龙眼树,为避免气温过高影响样本质量,采集时间为上午8点左右。从每棵龙眼树冠的上、中、下3个部位和东、南、西、北4个方位均匀随机采集嫩叶、成熟叶和老熟叶3个生长阶段的龙眼叶各100张。嫩叶叶色淡绿,质地较软;成熟叶叶色浓绿,质地较硬脆;老熟叶叶色墨绿,质地硬脆[13]。另外辅以SPAD值作为分类参考,经多次测量,嫩叶、成熟叶和老熟叶的SPAD值范围依次为(10, 25]、(25, 45]和(45, 68]。由于叶绿素高温下见光易分解,所以采集的样本保存于冰袋中,编号后立即带回实验室进行高光谱图像采集及叶绿素含量化学测定。另外采集5张出现病斑的叶片,探究病斑处叶绿素含量分布情况。
1.2 光谱数据采集
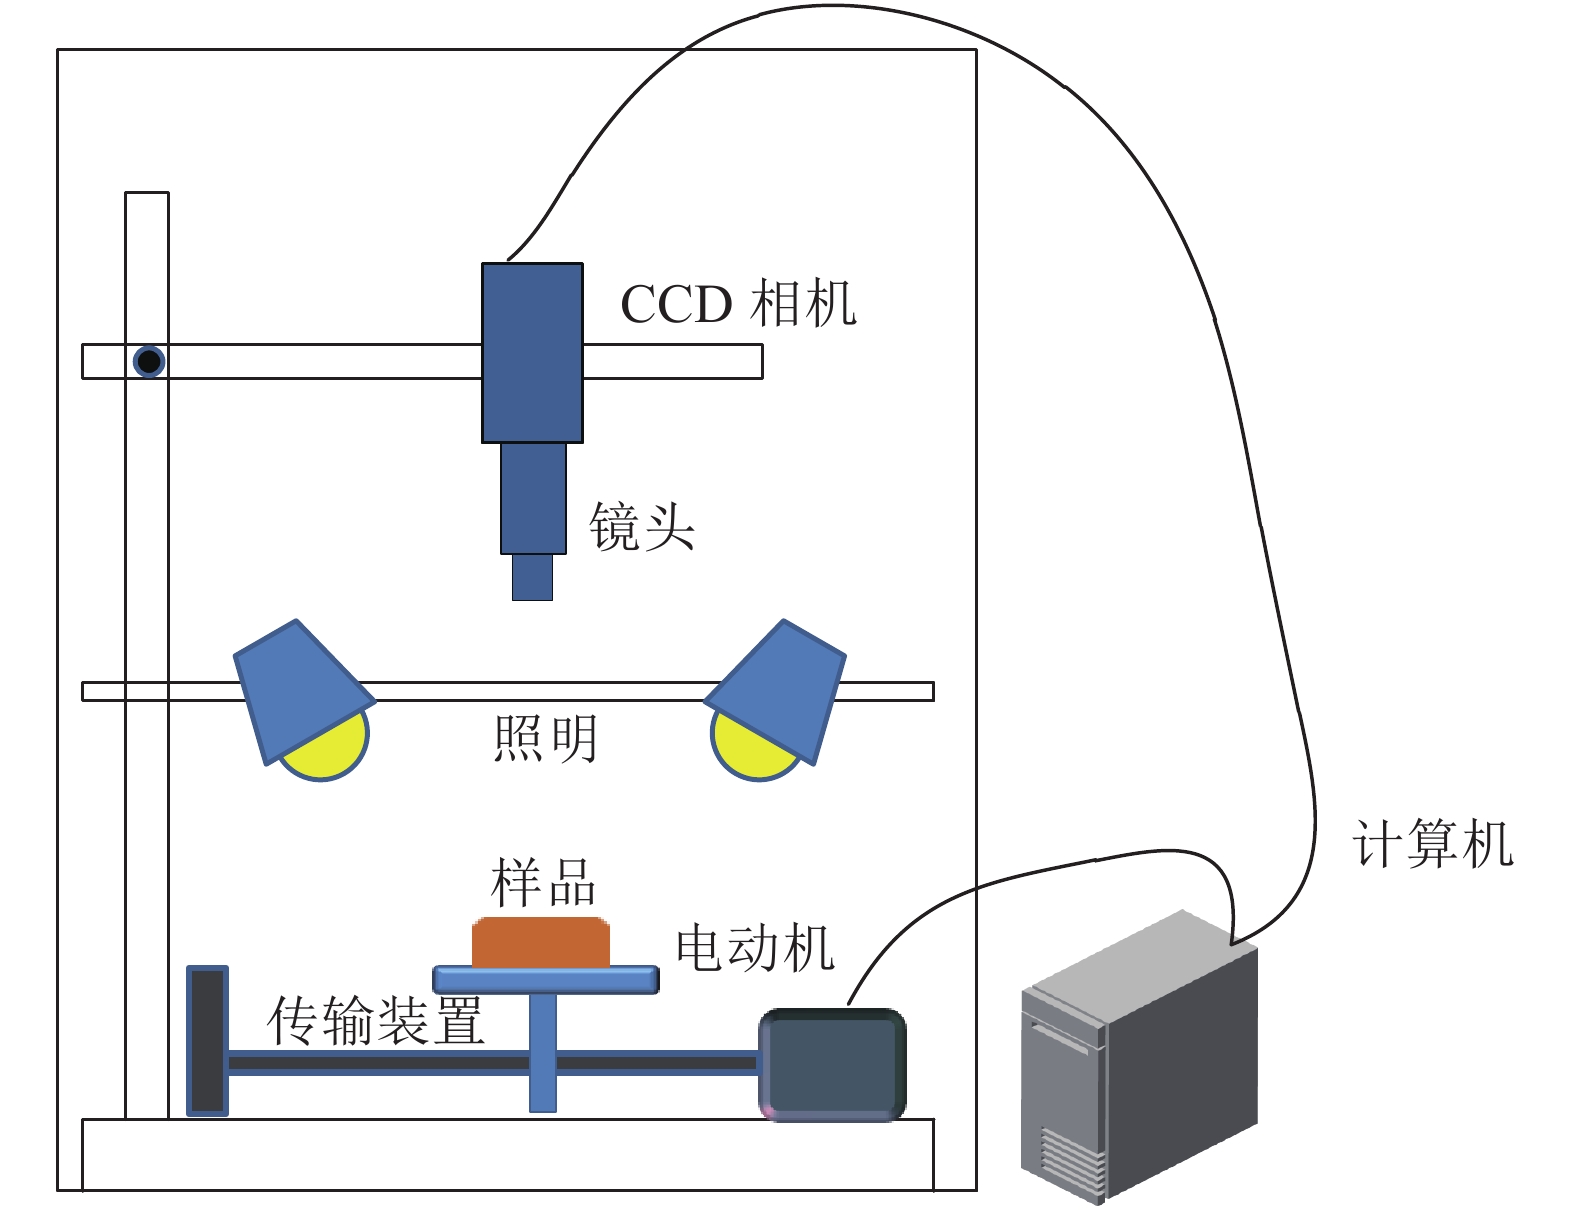
试验所用的高光谱成像仪(HyperSIS,Zolix,China)主要由4个卤光灯、CCD相机(Gilden Photonics Ltd.,UK)、样品移动台等部件组成。CCD相机曝光时间设置为15 ms,平台移动速度为4.5 mm·s–1,光谱波长范围369~988 nm,光谱分辨率1.2 nm。高光谱成像仪控制及图像校正软件为SpectraSENS(Dutch)。高光谱成像仪系统组成如图1所示。
为了防止基线漂移,需打开卤素灯,等待30 min后开始对300个样本进行扫描。在处理扫描生成的高光谱图像前,需要对每个样本的图像进行黑白校正。矫正公式如下:
$$ {I_{\rm{c}}} = \frac{{{R_{\rm {raw}}} - B}}{{W - B}}, $$ (1) 式中,W为对标配的白板扫描获取反射率接近100%的全白标定图像文件,B为盖上CCD相机镜头扫描获取反射率为0的全黑标定图像文件,Rraw为未标定的样本图像文件,Ic为校正后的高光谱图像文件。
1.3 龙眼叶片叶绿素含量及分布的测定
由于SPAD值仅为叶绿素浓度相对值,故试验采用分光光度法获取真实值以提高模型检测的准确性。在所有龙眼叶片高光谱图像采集完毕后,立即开始用分光光度法测定每片叶子的叶绿素含量。选取整张叶片,去除中间大叶脉后称质量,将去除叶脉后的龙眼叶片剪成丝和少量石英砂、碳酸钙粉及体积分数为80%的丙酮溶液2~3 mL混合于研钵中研磨至组织发白,研成匀浆,于室温(25 ℃)下暗处静置10 min;经过滤、反复冲洗研钵和研棒确保叶片色素全部进入容量瓶。用紫外–可见分光光度计分别测量663、645和652 nm处的吸光度(D),最后依据叶绿素a和叶绿素b的含量与吸光度的关系计算出总的叶绿素含量[17]。
将嫩叶、成熟叶、老熟叶3个批次的样本数据分别随机选取80%(每个批次为80个样本,全批次为240个样本)的数据作为校正集(Calibration set),建立校正模型,余下20%(每个批次为20个样本,全批次为60个样本)作为验证集(Validation set),用于检验模型的性能,3个批次样本组成全生长期样本。
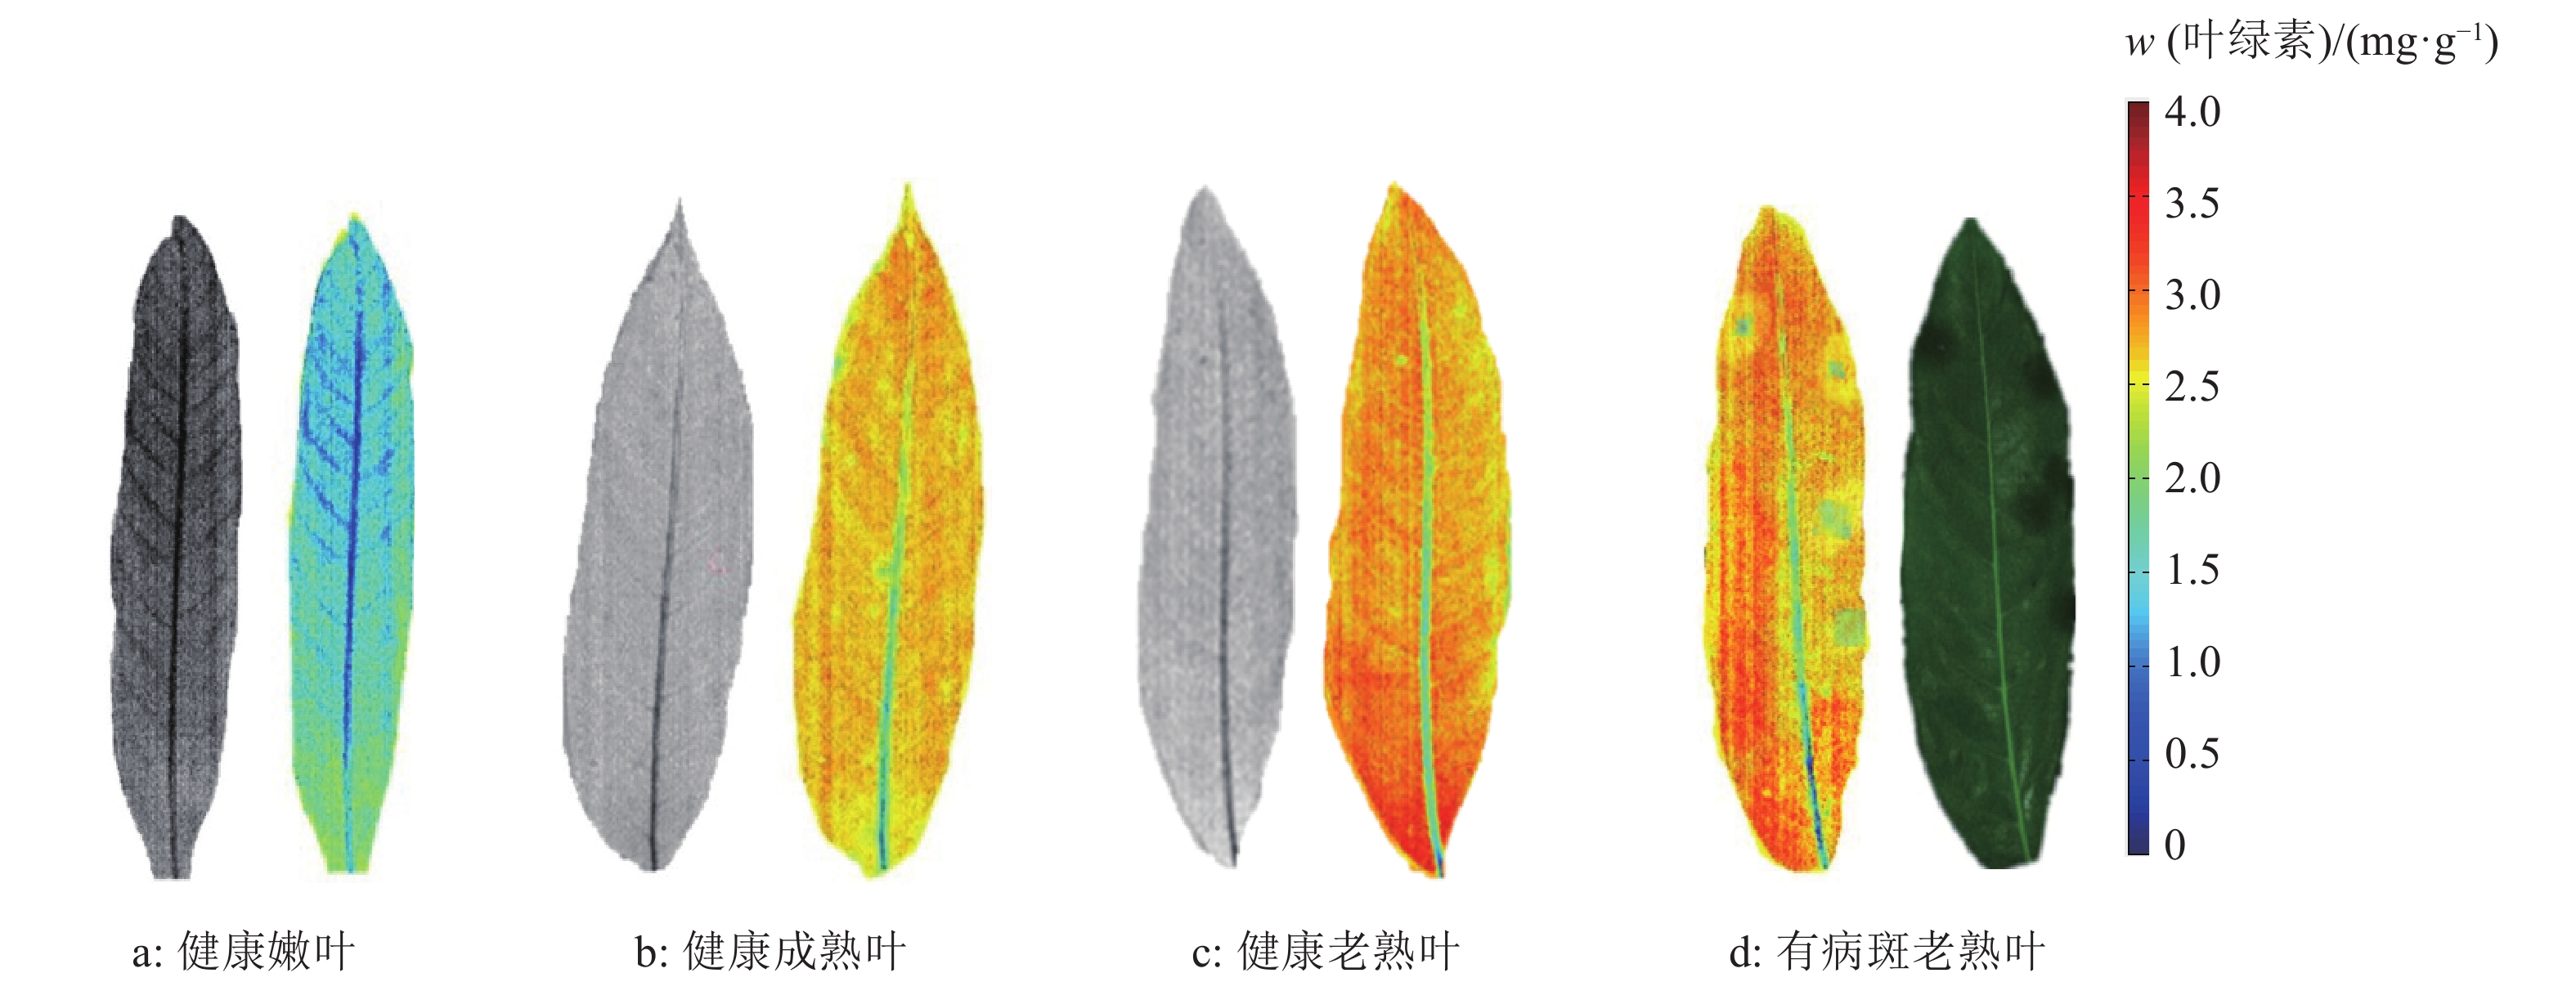
选取3个生长阶段的健康叶片和病斑叶片各1张,SAE模型预测出每个像素点的叶绿素含量进而获得完整的叶绿素含量分布图,用灰度图和彩色图表示叶绿素含量分布情况[18-19]。
1.4 高光谱数据预处理
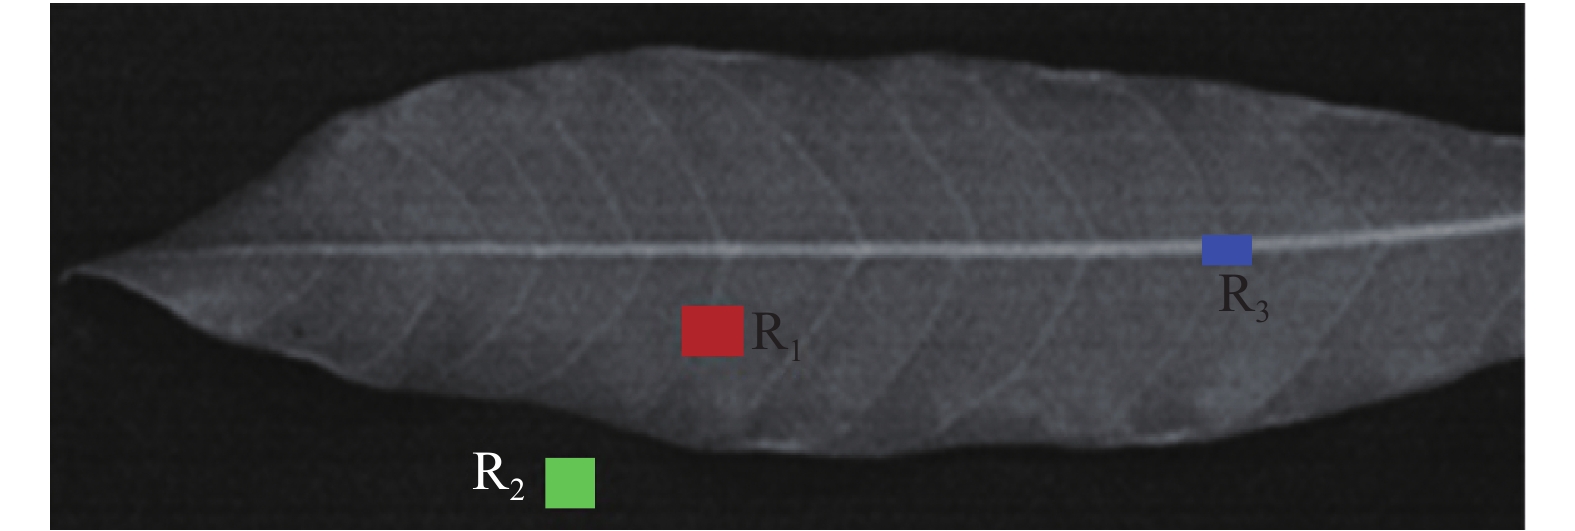
传统的手工提取感兴趣区域的方法费时费力,效率低,故提出一种自动提取感兴趣区域的方法。首先,选定叶肉一个矩形区域R1,在背景区域选定感兴趣区域R2,叶脉区域标志为R3(图2),并求出该区域所有像素的平均反射率。
![]() 图 2 龙眼叶片高光谱图像不同区域划分R1:叶肉区域;R2:背景区域;R3:叶脉区域Figure 2. Different regions in a hyperspectral image of Longan leaf
图 2 龙眼叶片高光谱图像不同区域划分R1:叶肉区域;R2:背景区域;R3:叶脉区域Figure 2. Different regions in a hyperspectral image of Longan leaf1.5 分析方法
皮尔森相关系数(Pearson correlation coefficient,r)是一种用来反映2个变量线性相关程度的统计量,故采用该指标分析龙眼叶片在生长过程中各波段光谱响应与叶绿素含量之间相关性的变化规律。用决定系数(r2)和均方根误差(RMSE)来评估叶绿素含量预测模型的性能。深度学习(Deep learning)是当前人工智能领域最热门的研究之一,本试验尝试采用深度学习中的稀疏自编码(Sparse auto-encoder,SAE)模型预测叶绿素含量。高光谱具有“图谱合一”的特性,为了充分利用高光谱图像特征信息,故以灰度共生矩阵(Gray-level co-occurrence matrix)表征图像纹理特征,并探讨特征波段的图像纹理特征与叶绿素含量的相关性。
2. 结果与分析
2.1 高光谱图像自动提取感兴趣区域的效果
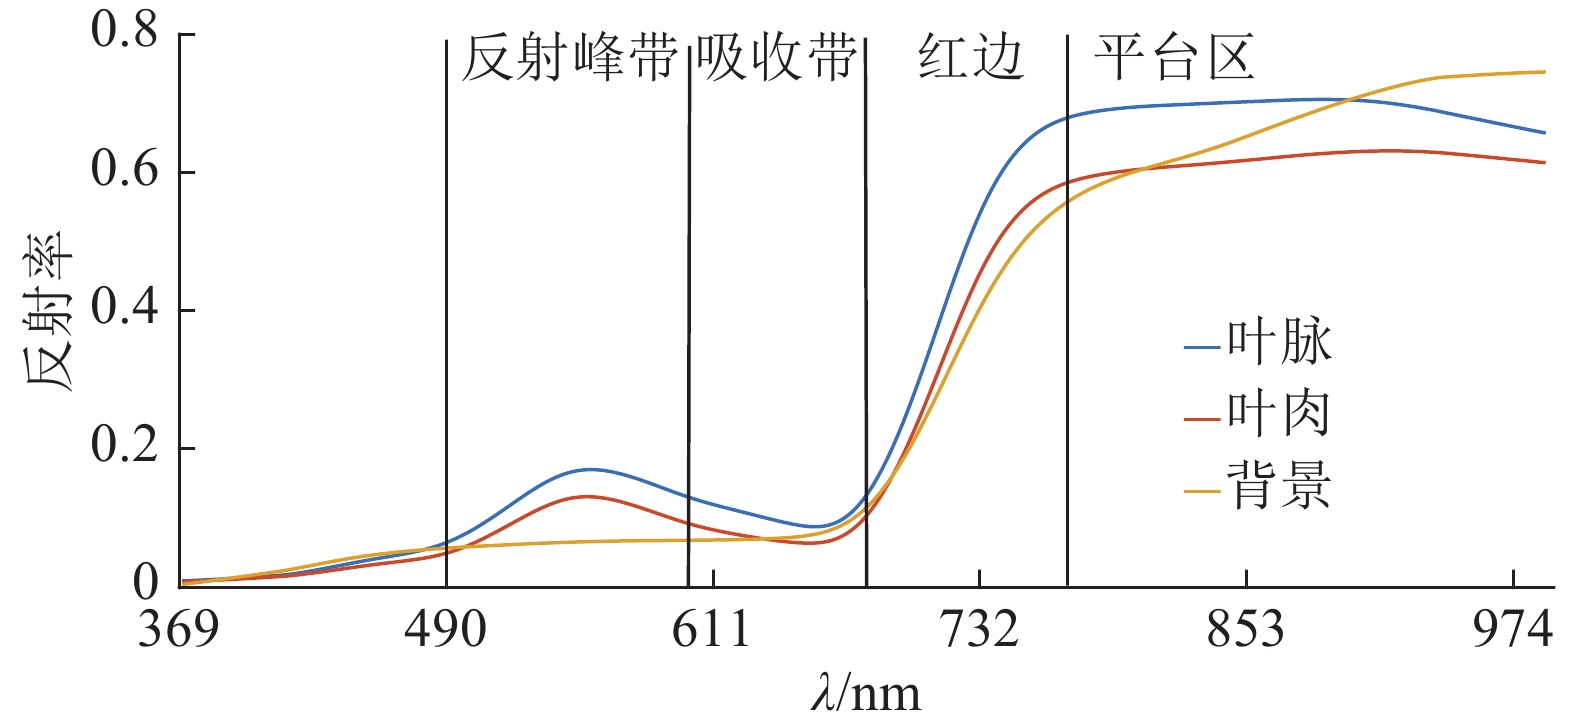
图3表明龙眼叶的叶肉与叶脉区域的光谱特征在550 nm左右出现反射波峰,与背景的反差较大,可以利用这个明显差异自动将高光谱图像分割成叶片和背景2个区域。该方法取得较佳效果,成功率为100%。
![]() 图 3 叶肉、背景与叶脉区域的光谱特征Figure 3. The spectral characterisitics of mesophyll, background and vein
图 3 叶肉、背景与叶脉区域的光谱特征Figure 3. The spectral characterisitics of mesophyll, background and vein背景部分阈值分割后进行掩膜处理。利用以上方法获取感兴趣区域(图4)后,提取每个样本的感兴趣区域光谱信息,计算该区域的平均光谱,选用光谱去噪中常用的Savitzky-Golay滤波对原始光谱和图像进行去噪处理。
![]() 图 4 自动提取感兴趣区域去噪后的效果Figure 4. The effect of automatically extracted image of interest area after background removal
图 4 自动提取感兴趣区域去噪后的效果Figure 4. The effect of automatically extracted image of interest area after background removal2.2 不同生长阶段龙眼叶片光谱响应特征
龙眼叶片在生长发育过程中,汲取外界物质和能量,不同阶段的物质种类和含量以及叶片组织结构、叶肉细胞形态等发生改变,导致叶片表现出对光的不同吸收度,从而使得不同生长阶段叶片整体表现出不同的光谱响应特性。
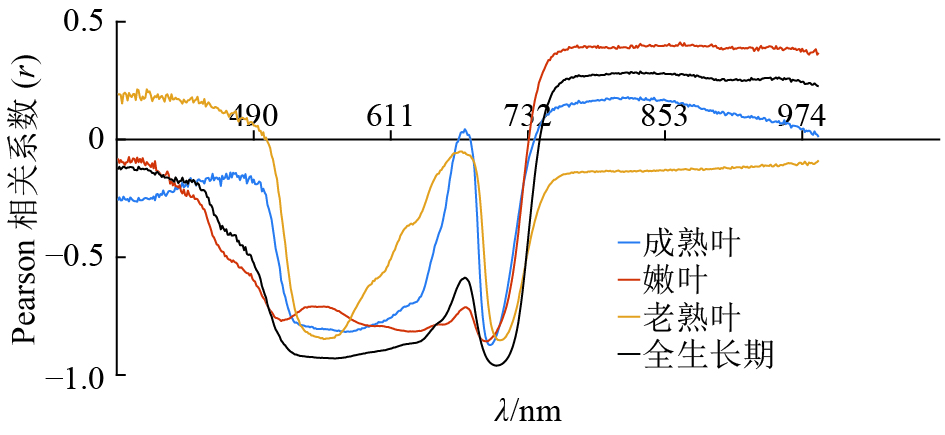
基于Pearson相关系数对龙眼叶片3个生长阶段和全生长期的叶片各波段进行相关性分析,结果见图5。 一般情况下,相关系数绝对值(|r|)≥0.6则表示2个变量之间为强相关性。从图5中选取|r|≥0.6的波段,得到嫩叶、成熟叶、老熟叶和全生长期强相关性的波段数分别为194、149、95和182个,强相关性的波段数随着叶片生长逐渐减少,在老熟叶阶段出现明显的“双峰”。在700 nm附近,叶片3个生长期相关系数曲线均出现波峰,并且该波峰随着生长期推进而愈加尖锐。在成熟叶阶段该波峰突破横坐标轴,由负相关转为正相关。在550 nm附近反射率高峰被称为“绿峰”,这个波段范围属于黄绿光波段,在该区域下的光波不容易激发叶绿素的光合作用效应,故被吸收的光能较少,但在3个生长期和全生长期都表现出较强的负相关性,由此可见,难以激发叶绿素光合作用的波段也能表现出与叶绿素含量之间的较强相关性。
![]() 图 5 龙眼叶片不同生长期光谱特性的相关性分析Figure 5. Correlation analyses of spectral characteristics of Longan leaves in different growth periods
图 5 龙眼叶片不同生长期光谱特性的相关性分析Figure 5. Correlation analyses of spectral characteristics of Longan leaves in different growth periods嫩叶、成熟叶、老熟叶的叶绿素质量分数的范围分别为:0.721 1~1.356 2、1.368 8~2.614 9和2.642 3~3.416 3 mg·g–1。表1为龙眼叶片样本校正集与验证集的叶绿素含量。由表1可以看出,校正集和验证集的最大值、最小值、平均值和标准偏差比较相近,说明数据集随机分配合理。
表 1 龙眼叶片样本校正集与验证集的叶绿素含量Table 1. Chlorophyll contents in Longan leaves for calibration and validation sets项目 样本数/个 w(叶绿素)/(mg·g–1) 最大值 最小值 平均值 标准偏差 校正集 240 3.416 3 0.731 4 1.915 5 0.531 2 验证集 60 3.353 2 0.721 1 1.930 1 0.520 2 由表2可以看出,嫩叶、成熟叶和老熟叶3个阶段的相关性最高的波长依次为692、698和705 nm,均属红边波段,随着叶片的生长,叶片对光谱的最敏感波段表现出“红移”现象,这是因为叶绿素含量增加导致敏感波段的移动,随着叶片生长,细胞间隙和物质含量比的变化会导致光波在叶肉细胞内的反射和吸收随之改变。全生长期的最敏感波段相关性远高于3个生长发育期,r达到0.890 3。另外,基于最高相关性波段的线性回归方法反演叶绿素含量的效果在叶片不同生长发育期差异较大,其中嫩叶的反演效果最差。
表 2 龙眼叶片叶绿素含量与光谱特性相关性分析建模及验证结果1)Table 2. Modeling and validation of correlation between chlorophyll content and spectral characteristic of Longan leaves生长阶段 强相关
波长/nm入选波
段数/个最高相关性
波长/nm最高相关
系数(r)基于最高相关性
波长的回归方程校正集 验证集 R2c RMSEc R2v RMSEv 嫩叶 488~722 194 692 –0.856 9 y=–105.2x+55.8 0.657 9 0.577 6 0.551 3 0.600 1 成熟叶 508~648、682~721 149 698 –0.873 0 y=–270.6x+81.7 0.682 1 0.555 2 0.605 5 0.574 3 老熟叶 509~603、690~712 95 705 –0.852 3 y=–168.1x+86.2 0.676 5 0.566 5 0.599 1 0.589 4 全生长期 495~715 182 703 –0.890 3 y=–188.9x+82.5 0.762 2 0.256 9 0.621 2 0.289 6 1)回归方程中,x:最高相关性波段的反射率,y:叶绿素含量 2.3 基于光谱特征参数的龙眼叶片叶绿素含量反演
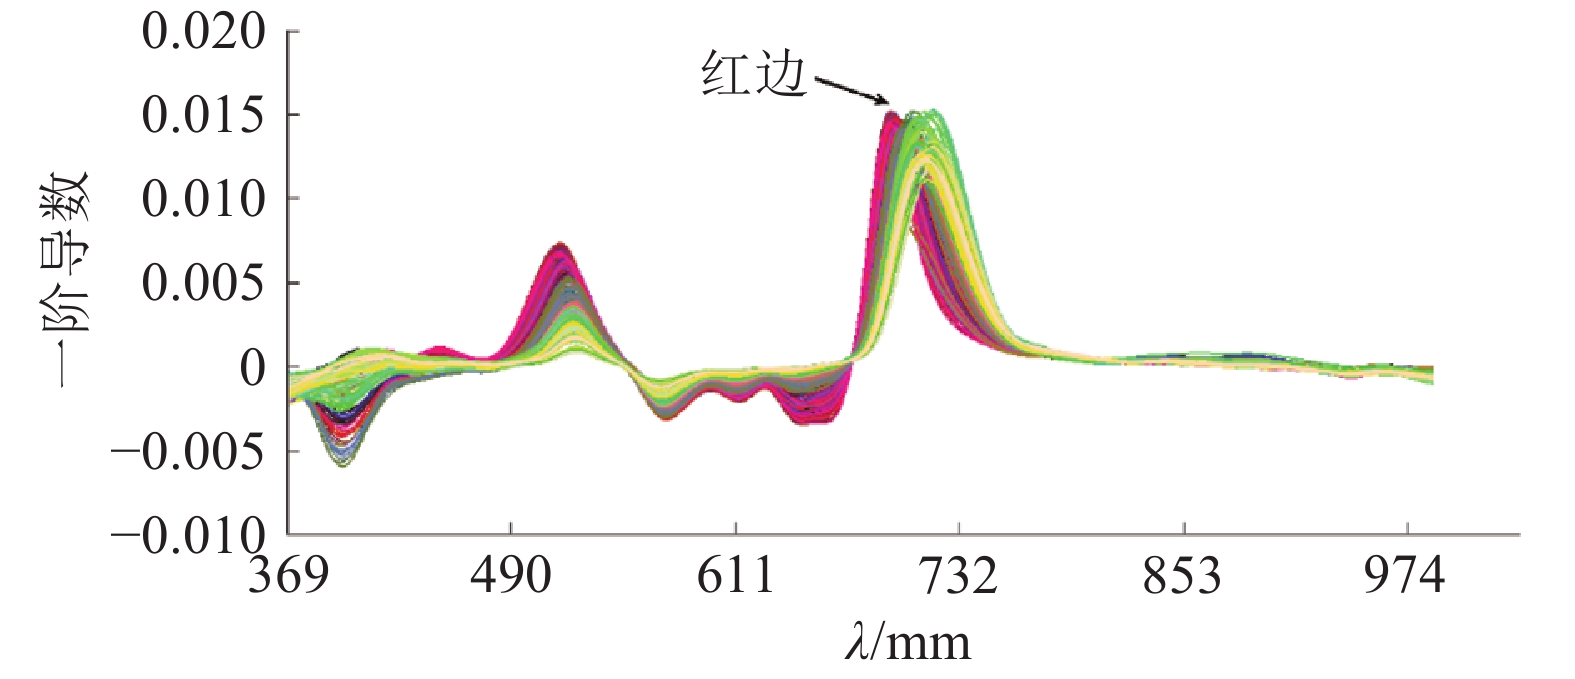
在光波的作用下,特定波段处光波的反射或吸收率与物质成分和结构形成特有的相关关系,这一特征被称作光谱特征。红边是由在红外波段植被叶绿素的强吸收以及近红外波段光在植被叶片内部的多次散射形成的强反射造成的[20]。图6显示了龙眼嫩叶、成熟叶、老熟叶3个生长阶段的300个样本的光谱曲线一阶导数。由图6可见,3个叶片生长阶段红边位置平均值依次为693、699和711 nm,随着叶片生长发育,红边出现“红移”现象,并且嫩叶、成熟叶的红边位置和表2中各生长阶段的最高相关波段较相近。由于龙眼叶片生长发育过程中不仅仅是叶绿素含量的增加,同时还伴随着叶片内各细胞组织的形态结构和间隙的变化,因此本试验采用与叶绿素含量有密切关系的红边区域(683~765 nm)、叶绿素强反射峰带(绿边和黄边,490~595 nm)和吸收带(595~682 nm)及与细胞结构和含水量相关的光谱曲线平台区(800~960 nm)参数反演叶绿素含量。
前人的研究表明,红边幅值、红边位置、红边面积这3个参数与叶绿素含量有较强相关性[21-22]。本试验从反射率总和及反射峰带极值位置和吸收带波谷的极值位置探讨其与全生长期龙眼叶片叶绿素含量的相关性,并两两组合建立叶绿素含量最小二乘回归预测模型,结果见表3。表3的结果表明,红边位置(x1)与叶绿素含量相关性较强,这与前人研究相符,其验证集模型R2v=0.756 7,RMSEv=0.301 2;红边反射率总和(x2)与叶绿素含量相关性较弱,但是反射峰带所有反射率总和(x4)及吸收带所有反射率总和(x6)表现出与叶绿素含量的强负相关性,其验证集模型决定系数分别达到0.680 1和0.656 7;反射峰带最大反射率位置(x3)建立的叶绿素含量反演模型精度较差(R2c=0.175 0,RMSEc=1.204 5,R2v=0.155 4,RMSEv=1.468 2),而吸收带最小反射率位置(x5)反演叶绿素含量的效果较佳(R2c=0.816 8,RMSEc= 0.234 4,R2v=0.757 9,RMSEv=0.296 0)。平台区反射率总和(x7)建立的模型预测效果最差(R2c=0.062 1,RMSEc=1.364 9,R2v=0.051 5,RMSEv=1.379 2),这是因为该区域的特征主要与细胞结构和水分含量有关。在两两组合建立的叶绿素含量偏最小二乘回归预测模型中,吸收带最小反射率位置和吸收带反射率总和建立的回归模型预测效果最好(R2c=0.856 8,RMSEc=0.219 5,R2v=0.771 2,RMSEv=0.286 2),其校正集和验证集决定系数均高于单一参数建立的预测模型,提高了光谱信息的利用率。
表 3 不同光谱特征参数的龙眼叶片叶绿素含量反演结果Table 3. The inversion results of chlorophyll contents of Longan leaves based on different spectral characteristic parameters回归模型1) 校正集 验证集 R2c RMSEc R2v RMSEv y=0.155x1–106.1 0.823 4 0.232 4 0.756 7 0.301 2 y=–0.342x2+11.7 0.472 3 0.795 1 0.338 7 0.845 3 y=0.086x1–0.212x2–36.4 0.742 4 0.302 5 0.654 5 0.386 5 y=–0.434x3+242.1 0.175 0 1.204 5 0.155 4 1.468 2 y=–0.24x4+5.5 0.793 8 0.253 4 0.680 1 0.299 6 y=104.4–0.315x3+2.99x4 0.686 5 0.289 0 0.595 1 0.421 3 y=–0.14x5+95.5 0.816 8 0.234 4 0.757 9 0.296 0 y=–0.431x6+5.5 0.718 5 0.286 5 0.656 7 0.301 3 y=55.3–0.082x5+0.017x6 0.856 8 0.219 5 0.771 2 0.286 2 y=0.058x7+1.9 0.062 1 1.364 9 0.051 5 1.379 2 1) x1: 红边位置, 683~765 nm光谱曲线一阶导数最大值波段;x2: 683~765 nm红边反射率总和;x3: 490~595 nm反射率最大值波段;x4: 490~595 nm反射峰带所有反射率总和;x5: 595~682 nm吸收带反射率最小的波段;x6: 595~682 nm吸收带所有反射率总和;x7: 平台区800~960 nm所有反射率总和;y: 叶绿素含量 为了验证吸收带最小反射率位置和吸收带反射率总和建立的回归模型预测性能在龙眼叶片不同生长阶段的稳定性,以嫩叶、成熟叶和老熟叶3个生长阶段的叶片样本分别作为验证集进行测试。测试结果表明: 3个生长阶段R2v 分别为0.72 1 5、0.805 2和0.763 8,RMSEv分别为0.300 1、0.238 9和0.287 7,3组数据R2v的标准偏差为0.041 8。表明了模型预测性能较好。
2.4 基于稀疏自编码器的叶绿素含量反演
2.4.1 特征波段图像纹理特征与叶绿素含量的相关性
植物的营养和健康状况均会影响叶片图像的纹理特征,本试验以灰度共生矩阵表征图像纹理特征,采用Matlab中的Graycomatrix函数获取特征波段图像的对比度(Contrast)、相关性(Correlation)、能量(Energy)和同质性(Homogeneity),统计距离设置为1,特征波段图像选择与叶绿素含量相关性较高的波段,即“绿峰”波长550 nm、吸收带最小反射率波长677 nm、全生长期最高相关性波长703 nm,分别沿0、45°、90°和135° 这4个方向提取纹理特征并取平均值作为样本的纹理特征[23],各生长阶段龙眼叶片特征波段图像纹理特征与实测叶绿素含量的相关性分析结果见表4。表4 的结果表明,对比度与叶片叶绿素含量的相关性在3个生长阶段和全生长期均表现为负相关,且相关性较弱;相关性、能量、同质性与叶片叶绿素含量在3个生长阶段和全生长期均表现为正相关,且整体上表现为随着叶片的生长相关性增强,能量和同质性与叶片叶绿素含量表现出强相关性(r均大于0.6)。
表 4 不同生长阶段龙眼叶片特征波段图像纹理特征与叶绿素含量的相关系数(r)Table 4. The correlation coefficients of chlorophyll contents and texture parameters from characteristic wavelength images of Longyan leaves in different periodsλ/nm 嫩叶 成熟叶 老熟叶 全生长期 对比度 相关性 能量 同质性 对比度 相关性 能量 同质性 对比度 相关性 能量 同质性 对比度 相关性 能量 同质性 550 –0.37 0.54 0.61 0.64 –0.45 0.55 0.65 0.67 –0.44 0.56 0.66 0.69 –0.46 0.53 0.67 0.69 677 –0.41 0.56 0.62 0.64 –0.46 0.55 0.69 0.68 –0.50 0.60 0.69 0.71 –0.48 0.58 0.68 0.69 703 –0.48 0.55 0.65 0.62 –0.55 0.60 0.70 0.71 –0.51 0.63 0.71 0.72 –0.50 0.61 0.68 0.70 2.4.2 “图谱信息”融合建立的叶绿素含量反演模型
在叶绿素含量的高光谱反演研究中,常用BP神经网络进行预测,但传统神经网络易陷入局部最优。SAE模型是深度学习中的经典模型,收敛速度快,系统在进行微调之前,网络参数已设定在最优参数附近,解决了传统神经网络易陷入局部最优的问题,其贪婪式学习方式使得其预测效果受噪声影响较小[24]。高光谱图像具有“图谱合一”的优点,本试验尝试将“图谱信息”(图像特征和光谱特征)相融合,输入SAE模型,预测叶绿素含量。图像特征选取550、677和703 nm图像下0、45°、90°和135° 共4个方向纹理特征的能量及同质性(共24维变量),选取这3个波段下的光谱特征(共3维变量),两者联合组成27维向量。
将下降批次设置为3;由于隐含层数过高会导致过拟合现象[25-27],故将隐含层数设置为4;经过试验确定各隐含层神经元数分别为25、20、20和25。单独将图像特征导入SAE模型,模型校正集和验证集的预测效果为:
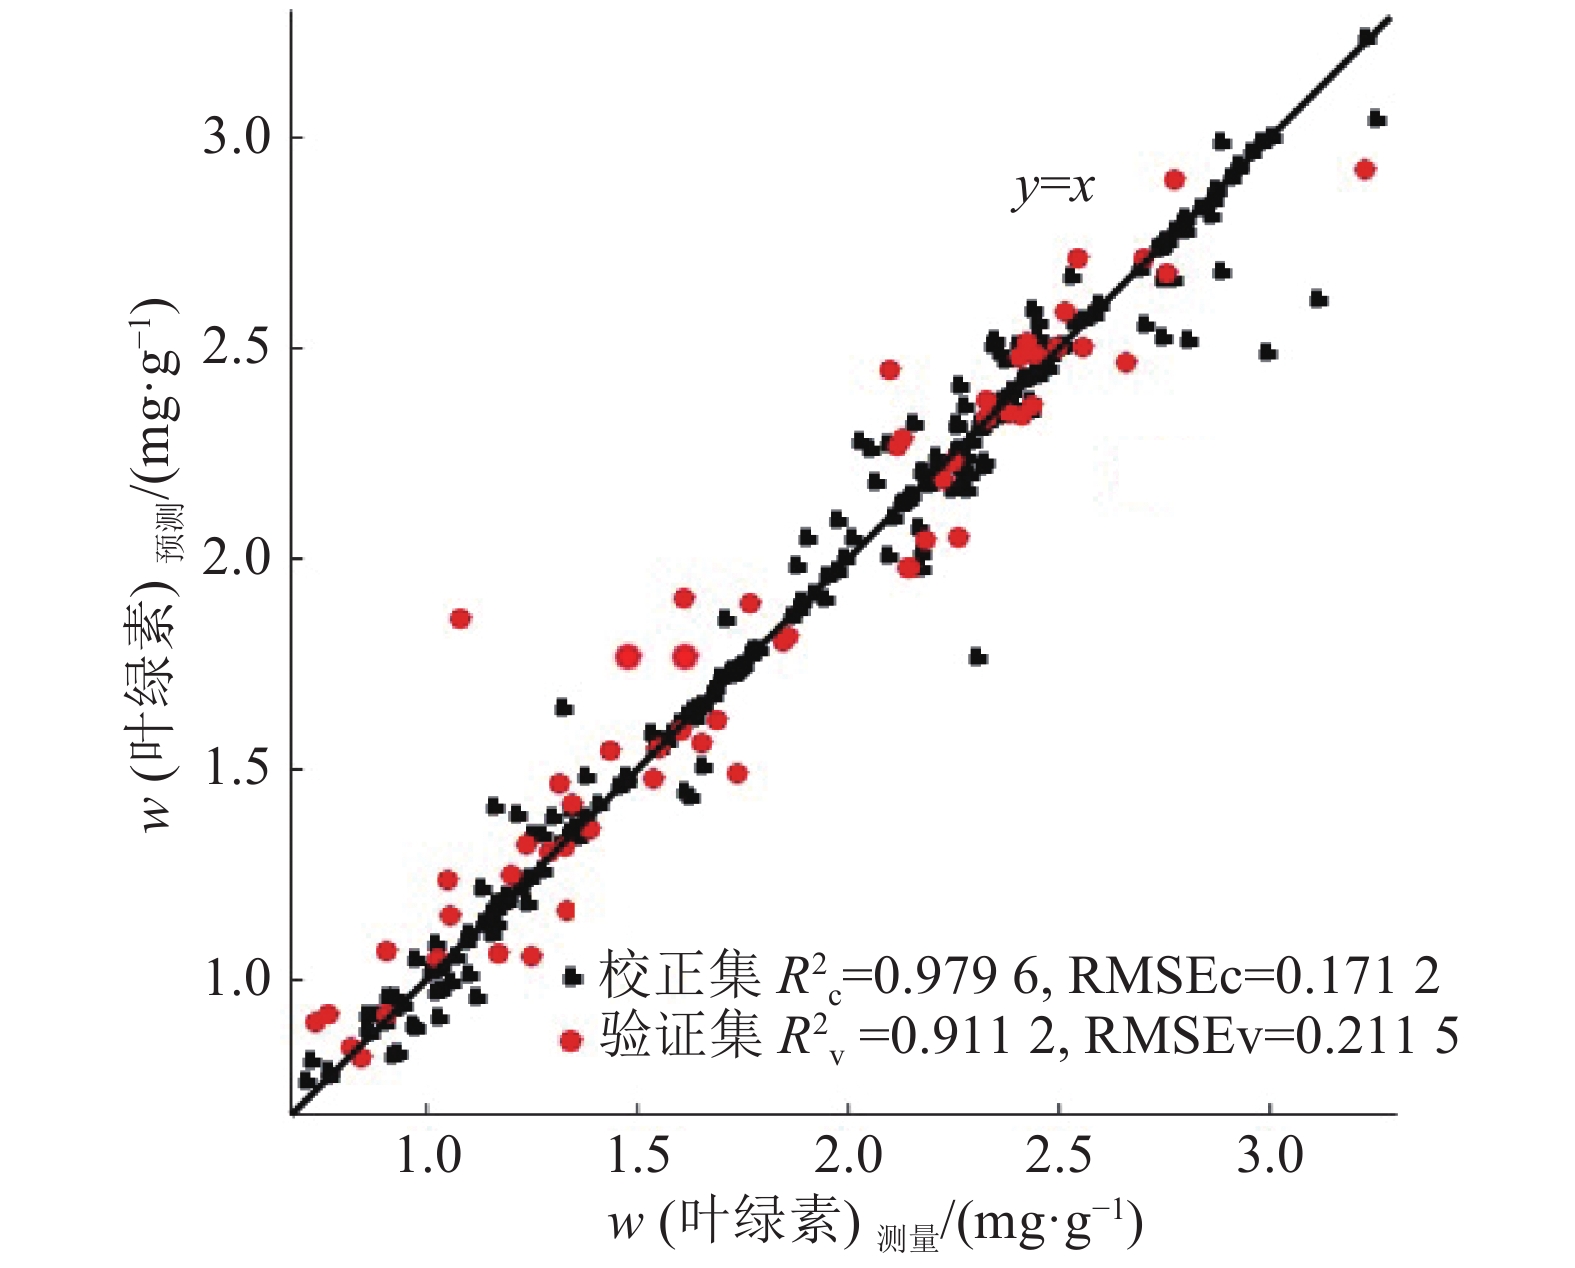
${{R}}_{\rm{c}}^2$ =0.620 2,RMSEc=0.331 4;${{R}}_{\rm{v}}^2$ =0.588 7,RMSEv=0.343 6。由此可见单独将纹理特征作为输入的模型预测效果不佳。将图像特征联合光谱特征作为输入,其预测效果如图7所示。由图7可以看出,SAE模型的预测精度较高,校正集${{R}}_{\rm{c}}^2$ 为0.979 6,RMSEc为0.171 2;验证集${{R}}_{\rm{v}}^2$ 为0.911 2,RMSEv为0.211 5。![]() 图 7 基于图像特征及光谱特征的SAE模型预测的龙眼叶片叶绿素含量Figure 7. Prediction of chlorophyll contents of Longyan leaves using SAE model based on image and spectral features
图 7 基于图像特征及光谱特征的SAE模型预测的龙眼叶片叶绿素含量Figure 7. Prediction of chlorophyll contents of Longyan leaves using SAE model based on image and spectral features为了验证模型预测性能在龙眼叶片不同生长阶段的稳定性,以嫩叶、成熟叶和老熟叶3个生长阶段的叶片样本分别作为验证集进行测试。测试结果表明:3个生长阶段
${{R}}_{\rm{v}}^2$ 分别为0.901 0、0.925 8和0.909 8,RMSEv分别为0.211 8 、0.197 0和0.219 9,3组数据${{R}}_{\rm{v}}^2$ 的标准偏差为0.012 5,仅为偏最小二乘回归模型标准偏差(0.041 8)的29.9%,预测性能表现相对更稳定。2.5 龙眼叶片叶绿素含量分布预测
SAE模型结合“图谱信息”预测龙眼叶绿素含量表现稳定、预测精度高。在叶绿素分布灰度图上,颜色越深表示含量越低;在彩色分布图上,蓝色表示叶绿素含量较低。基于SAE模型来预测整张龙眼叶片叶绿素含量分布情况见图8。由图8可以看出,健康龙眼叶片叶脉的叶绿素含量低于叶肉区域的叶绿素含量,叶基部叶绿素含量高于叶尖部位叶绿素含量。另外,在叶肉区域分布着密度高且含有叶绿素的叶绿体,而叶脉多为导管,故叶脉叶绿素浓度较低。而带有病斑的老熟叶病斑区域叶绿素含量明显低于周围未感染区域,病斑中心叶绿素含量最低,但基本保持在2 mg·g–1左右,说明叶片处于感染初期。叶片不同部位叶绿素含量差异较大,因此基于单值的SPAD值无法反映整张叶片的营养和健康状况,说明预测叶绿素含量分布对于评估叶片营养和健康状况是必要的。
![]() 图 8 基于SAE模型预测的龙眼叶片叶绿素含量分布图Figure 8. Distribution maps of chlorophyll contents of Longyan leaves based on SAE model
图 8 基于SAE模型预测的龙眼叶片叶绿素含量分布图Figure 8. Distribution maps of chlorophyll contents of Longyan leaves based on SAE model3. 讨论与结论
本研究提出了一种感兴趣区域自动提取的方法,成功率为100%。龙眼叶片在嫩叶、成熟叶、老熟叶这3个生长阶段与叶绿素含量相关性最高的波段及红边位置均表现出“红移”现象,说明在不同生长阶段龙眼叶片的叶绿素含量的敏感波段不同。已有研究多以全生长期叶片的敏感波段建立叶绿素含量的预测模型,不具备针对性,且预测精度普遍相对较低。本试验从反射率总和及反射峰带极值和吸收带波谷的极值位置探讨其与龙眼叶片叶绿素含量的相关性,结果发现反射峰带最大反射率位置建立的叶绿素含量反演模型预测精度较低(
${{R}}_{\rm{c}}^2$ =0.175 0,RMSEc=1.204 5,${{R}}_{\rm{v}}^2$ =0.155 4,RMSEv=1.468 2),而吸收带最小反射率位置反演叶绿素含量的效果较佳(${{R}}_{\rm{c}}^2$ =0.816 8,RMSEc=0.234 4,${{R}}_{\rm{v}}^2$ =0.757 9,RMSEv=0.296 0)。说明反射峰带和吸收带范围内,对叶绿素有强反射效应的波段位置与叶绿素含量呈弱相关性,而对叶绿素有强吸收效应的波段会随着叶绿素含量变化而移动,且两者存在强负相关关系。特征波段图像纹理特征与叶片叶绿素含量相关性分析中,对比度与叶绿素含量的相关性在3个叶片生长阶段和全生长期中均表现为负相关,但相关性较弱;相关性、能量和同质性与叶绿素含量在3个叶片生长阶段和全生长期均表现为正相关,并且能量和同质性与叶绿素含量表现为强相关(相关系数均大于0.6)。相比于吸收带最小反射率位置和吸收带反射率总和建立的回归模型,基于“图谱信息”融合的SAE模型预测性能受叶片成熟度影响相对较小,3个生长阶段的
${{R}}_{\rm{v}}^2$ 的标准偏差仅为最优偏最小二乘回归模型标准偏差的29.9%,且预测精度较高,校正集${{R}}_{\rm{c}}^2$ 为0.979 6、RMSEc为0.171 2,验证集${{R}}_{\rm{v}}^2$ 为0.911 2、RMSEv为0.2115,适用于不同成熟度的龙眼叶片叶绿素含量分布预测。基于光谱特征的回归模型对于不同生长阶段的叶片预测效果变化较大,而基于“图谱信息”融合的SAE模型预测性能受叶片成熟度影响相对较小,这一结果与以下因素有关:1)叶片生长发育过程中的变化不是简单的叶绿素含量增加,同时还伴随非量化、非线性但影响光吸收和反射的因素,如细胞组织、细胞间隙和表皮光滑度的变化;2)叶绿素含量与光谱特征参数不是严格的线性映射关系,而SAE模型属于非线性预测模型;3)龙眼属于常绿乔木,相比于阔叶落叶树种,叶绿素含量变化幅度较小,不利于构建泛化能力强的线性模型;4)“图谱信息”融合使得SAE模型容纳更多与叶绿素含量相关的信息[28-29]。叶片不同部位叶绿素含量差异较大,预测叶绿素含量分布对于评估叶片营养和健康状况是必要的。基于“图谱信息”融合的SAE模型预测整张龙眼叶片叶绿素含量分布,预测效果较好。灰度图和彩色图均能看到清晰的叶脉分布,叶绿素含量高低大致情况:叶基部>叶尖、叶肉区域>叶脉,随着叶片生长,叶脉和叶肉区域的叶绿素含量差别逐渐减小,叶绿素含量呈明显的上升趋势且分布趋于均匀。这可能是因为气孔是叶片与外界气体交换的场合,其密度越高新陈代谢越旺盛[30],同时缺氧会影响叶绿素合成,叶片下表皮气孔密度从基部到叶尖、从叶缘到叶脉逐渐降低,合成叶绿素也随之减少[31-32]。不同生长阶段的龙眼叶片叶绿素含量分布的预测结果揭示了叶绿素分布规律随叶片生长发育的变化规律及病虫害对叶片叶绿素分布影响,为评估嫩叶抗寒能力、龙眼结果期的施肥量和老熟叶的修剪提供参考依据。
-
![]()
图 2 龙眼叶片高光谱图像不同区域划分
R1:叶肉区域;R2:背景区域;R3:叶脉区域
Figure 2. Different regions in a hyperspectral image of Longan leaf
![]()
图 3 叶肉、背景与叶脉区域的光谱特征
Figure 3. The spectral characterisitics of mesophyll, background and vein
![]()
图 4 自动提取感兴趣区域去噪后的效果
Figure 4. The effect of automatically extracted image of interest area after background removal
![]()
图 5 龙眼叶片不同生长期光谱特性的相关性分析
Figure 5. Correlation analyses of spectral characteristics of Longan leaves in different growth periods
![]()
图 7 基于图像特征及光谱特征的SAE模型预测的龙眼叶片叶绿素含量
Figure 7. Prediction of chlorophyll contents of Longyan leaves using SAE model based on image and spectral features
![]()
图 8 基于SAE模型预测的龙眼叶片叶绿素含量分布图
Figure 8. Distribution maps of chlorophyll contents of Longyan leaves based on SAE model
表 1 龙眼叶片样本校正集与验证集的叶绿素含量
Table 1 Chlorophyll contents in Longan leaves for calibration and validation sets
项目 样本数/个 w(叶绿素)/(mg·g–1) 最大值 最小值 平均值 标准偏差 校正集 240 3.416 3 0.731 4 1.915 5 0.531 2 验证集 60 3.353 2 0.721 1 1.930 1 0.520 2  下载: 导出CSV
表 2 龙眼叶片叶绿素含量与光谱特性相关性分析建模及验证结果1)
Table 2 Modeling and validation of correlation between chlorophyll content and spectral characteristic of Longan leaves
生长阶段 强相关
波长/nm入选波
段数/个最高相关性
波长/nm最高相关
系数(r)基于最高相关性
波长的回归方程校正集 验证集 R2c RMSEc R2v RMSEv 嫩叶 488~722 194 692 –0.856 9 y=–105.2x+55.8 0.657 9 0.577 6 0.551 3 0.600 1 成熟叶 508~648、682~721 149 698 –0.873 0 y=–270.6x+81.7 0.682 1 0.555 2 0.605 5 0.574 3 老熟叶 509~603、690~712 95 705 –0.852 3 y=–168.1x+86.2 0.676 5 0.566 5 0.599 1 0.589 4 全生长期 495~715 182 703 –0.890 3 y=–188.9x+82.5 0.762 2 0.256 9 0.621 2 0.289 6 1)回归方程中,x:最高相关性波段的反射率,y:叶绿素含量
下载: 导出CSV
表 3 不同光谱特征参数的龙眼叶片叶绿素含量反演结果
Table 3 The inversion results of chlorophyll contents of Longan leaves based on different spectral characteristic parameters
回归模型1) 校正集 验证集 R2c RMSEc R2v RMSEv y=0.155x1–106.1 0.823 4 0.232 4 0.756 7 0.301 2 y=–0.342x2+11.7 0.472 3 0.795 1 0.338 7 0.845 3 y=0.086x1–0.212x2–36.4 0.742 4 0.302 5 0.654 5 0.386 5 y=–0.434x3+242.1 0.175 0 1.204 5 0.155 4 1.468 2 y=–0.24x4+5.5 0.793 8 0.253 4 0.680 1 0.299 6 y=104.4–0.315x3+2.99x4 0.686 5 0.289 0 0.595 1 0.421 3 y=–0.14x5+95.5 0.816 8 0.234 4 0.757 9 0.296 0 y=–0.431x6+5.5 0.718 5 0.286 5 0.656 7 0.301 3 y=55.3–0.082x5+0.017x6 0.856 8 0.219 5 0.771 2 0.286 2 y=0.058x7+1.9 0.062 1 1.364 9 0.051 5 1.379 2 1) x1: 红边位置, 683~765 nm光谱曲线一阶导数最大值波段;x2: 683~765 nm红边反射率总和;x3: 490~595 nm反射率最大值波段;x4: 490~595 nm反射峰带所有反射率总和;x5: 595~682 nm吸收带反射率最小的波段;x6: 595~682 nm吸收带所有反射率总和;x7: 平台区800~960 nm所有反射率总和;y: 叶绿素含量
下载: 导出CSV
表 4 不同生长阶段龙眼叶片特征波段图像纹理特征与叶绿素含量的相关系数(r)
Table 4 The correlation coefficients of chlorophyll contents and texture parameters from characteristic wavelength images of Longyan leaves in different periods
λ/nm 嫩叶 成熟叶 老熟叶 全生长期 对比度 相关性 能量 同质性 对比度 相关性 能量 同质性 对比度 相关性 能量 同质性 对比度 相关性 能量 同质性 550 –0.37 0.54 0.61 0.64 –0.45 0.55 0.65 0.67 –0.44 0.56 0.66 0.69 –0.46 0.53 0.67 0.69 677 –0.41 0.56 0.62 0.64 –0.46 0.55 0.69 0.68 –0.50 0.60 0.69 0.71 –0.48 0.58 0.68 0.69 703 –0.48 0.55 0.65 0.62 –0.55 0.60 0.70 0.71 –0.51 0.63 0.71 0.72 –0.50 0.61 0.68 0.70
下载: 导出CSV
-
[1] 李粉玲, 王力, 刘京, 等. 基于高分一号卫星数据的冬小麦叶片SPAD值遥感估算[J]. 农业机械学报, 2015, 46(9): 273-281. [2] 何启平, 陈莹. 校园常见植物叶绿素提取方法比较及其含量测定[J]. 黑龙江农业科学, 2015(10): 117-120. [3] 丁永军, 李民赞, 安登奎, 等. 基于光谱特征参数的温室番茄叶片叶绿素含量检测[J]. 农业工程学报, 2011, 27(5): 244-247. [4] 岳学军, 全东平, 洪添胜, 等. 柑橘叶片叶绿素含量高光谱无损检测模型[J]. 农业工程学报, 2015, 31(1): 294-302. [5] 李媛媛, 常庆瑞, 刘秀英, 等. 基于高光谱和BP神经网络的玉米叶片SPAD值遥感估算[J]. 农业工程学报, 2016, 32(16): 135-142. [6] 冯雷, 骆一凡, 何勇, 等. 基于机器视觉技术的尖椒冠层SPAD值测定仪的开发[J]. 农业工程学报, 2016, 32(21): 177-182. [7] 赵艳茹, 余克强, 李晓丽, 等. 基于高光谱成像的南瓜叶片叶绿素分布可视化研究[J]. 光谱学与光谱分析, 2014, 34(5): 1378-1382. [8] 余克强, 赵艳茹, 李晓丽, 等. 高光谱成像技术的不同叶位尖椒叶片氮素分布可视化研究[J]. 光谱学与光谱分析, 2015, 35(3): 746-750. [9] CHENG J H, SUN D W, PU H, et al. Comparison of visible and long-wave near-infrared hyperspectral imaging for colour measurement of grass carp[J]. Innov Food Sci Emerg, 2014, 7(11): 3109-3120.
[10] 朱瑶迪, 邹小波, 石吉勇, 等. 高光谱图像技术快速预测发酵醋醅总酸分布[J]. 农业工程学报, 2014, 30(16): 320-327. [11] 李芳, 石吉勇, 张德涛, 等. 银杏叶中黄酮含量的叶面分布检测研究[J]. 食品工业科技, 2015, 36(9): 270-272. [12] JIN H L, LI L L, CHENG J H. Rapid and non-destructive determination of moisture content of peanut kernels using hyperspectral imaging technique[J]. Food Anal Method, 2015, 8(10): 2524-2532.
[13] 刘顺枝. 不同成熟度龙眼叶片组织显微结构的观察[J]. 嘉应大学学报, 2000, 18(6): 85-86. [14] 黄玉溢, 谭宏伟, 周柳强, 等. 龙眼施用长效氮肥的效应研究[J]. 南方农业学报, 2003(S2): 71-73. [15] 周庆贤, 周颂棠, 伦演鹏, 等. 广州地区石硖龙眼高产栽培技术[J]. 广东农业科学, 2005, 32(3): 83-84. [16] 彭庆芳. 浅谈龙眼优质高产栽培技术[J]. 吉林农业(学术版), 2010(7): 107. [17] 潘玲玲, 徐晓洁, 谭晶晶, 等. 分光光度法快速测定玉米叶片中的叶绿素[J]. 分析化学, 2007, 35(3): 413-415. [18] WU D, SHI H, WANG S, et al. Rapid prediction of moisture content of dehydrated prawns using online hyperspectral imaging system[J]. Analytica Chimica Acta, 2012, 726(9): 57-66.
[19] WU D, SUN D W, HE Y. Application of long-wave near infrared hyperspectral imaging for measurement of color distribution in salmon fillet[J]. Innov Food Sci Emerg, 2012, 16(39): 361-372.
[20] 张永贺, 郭啸川, 褚武道, 等. 基于红边位置的木荷叶片叶绿素含量估测模型研究[J]. 红外与激光工程, 2013, 42(3): 798-804. [21] 薛利红, 杨林章. 采用不同红边位置提取技术估测蔬菜叶绿素含量的比较研究[J]. 农业工程学报, 2008, 24(9): 165-169. [22] 梁爽, 赵庚星, 朱西存. 苹果树叶片叶绿素含量高光谱估测模型研究[J]. 光谱学与光谱分析, 2012, 32(5): 1367-1370. [23] 岳有军, 杨雪, 赵辉, 等. 基于支持向量机的油菜缺素诊断研究[J]. 广东农业科学, 2015, 42(20): 145-148. [24] 尹征, 唐春晖, 张轩雄. 基于改进型稀疏自动编码器的图像识别[J]. 电子科技, 2016, 29(1): 124-127. [25] 孙文珺, 邵思羽, 严如强. 基于稀疏自动编码深度神经网络的感应电动机故障诊断[J]. 机械工程学报, 2016, 52(9): 65-71. [26] LUO W, YANG J, XU W, et al. Locality-constrained sparse auto-encoder for image classification[J]. IEEE Signal Proc Let, 2015, 22(8): 1070-1073.
[27] VINCENT P, LAROCHELLE H, LAJOIE I, et al. Stacked denoising auto-encoders[J]. J Mach Learn Res, 2010, 11(12): 3371-3408.
[28] 刘文雅, 潘洁. 基于神经网络的马尾松叶绿素含量高光谱估算模型[J]. 应用生态学报, 2017, 28(4): 1128-1136. [29] 邹小波, 张小磊, 石吉勇, 等. 基于高光谱图像的黄瓜叶片叶绿素含量分布检测[J]. 农业工程学报, 2014, 30(13): 169-175. [30] 陈晨, 张永成. 马铃薯不同品种间气孔密度及叶绿素含量的差异性研究[J]. 中国农学通报, 2013, 29(27): 83-87. [31] 顾振芳, 王伟清, 朱爱萍, 等. 黄瓜对霜霉病的抗性与叶绿素含量、气孔密度的相关性[J]. 上海交通大学学报(农业科学版), 2004, 22(4): 381-384. [32] 颜惠霞, 徐秉良, 梁巧兰, 等. 南瓜品种对白粉病的抗病性与叶绿素含量和气孔密度的相关性[J]. 植物保护, 2009, 35(1): 79-81.


计量
- 文章访问数: 1885
- HTML全文浏览量: 6
- PDF下载量: 3097
