Genetic diversity of Zenia insignis based on SRAP markers
-
摘要:目的
研究任豆Zenia insignis种群遗传多样性,为有效保护任豆种质资源并进行遗传改良提供理论基础。
方法在建立任豆SRAP-PCR反应体系的基础上,对17个任豆种源进行遗传多样性分析,并利用UPGMA聚类分析,对任豆种源进行类群划分。
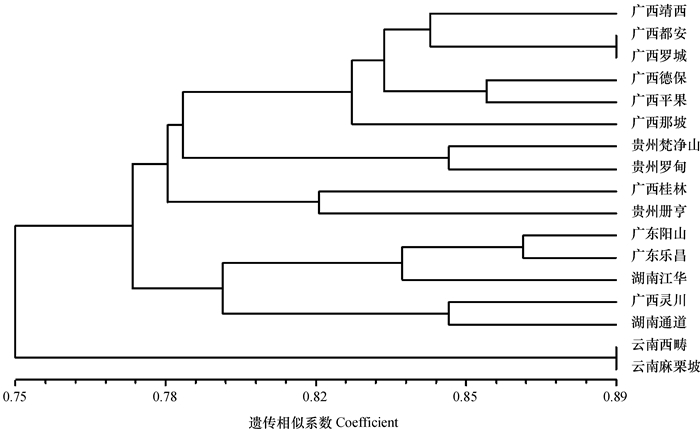
结果12对引物组合共扩增出151条带,平均每对引物获得12.58条。其中,多态性条带106条,平均每对引物8.83条,平均多态率为70.39%。种源间多态位点比率为38.96%~72.73%,平均为59.66%;基因多样性指数为0.175 5~0.313 3,平均为0.256 8;Shannon信息指数为0.249 4~0.450 2,平均为0.369 1;观测等位基因数(na)为1.519 5~1.727 3,平均达1.600 0,种源水平的na为1.724 9;有效等位基因数(ne)为1.330 5~1.577 3,平均达1.471 3,种源水平的ne为1.502 6;种源间的遗传一致度为0.703 1~0.886 5;遗传距离为0.120 5~0.352 3。根据聚类结果,将任豆17个种源分为3个地理类群:第1类为广西和贵州种源,第2类为广东、湖南和广西种源,第3类为云南种源,地理距离相近的种源基本上聚在同一类。
结论任豆种源间和种源个体间均存在较丰富的遗传多样性,且种源内更丰富,遗传改良时应更注重种源内个体的选择。任豆种源间基因流不高,且根据聚类结果划分的3个类群的地理格局明显,应是由任豆特定的生活环境造成的隔离所致。
Abstract:ObjectiveTo study population genetic diversity of Zenia insignis, and to provide a basis for Z. insignis germplasm protect and promote genetic improvement.
MethodBase on establishing of SRAP-PCR system in Z. insignis, the genetic diversity among 17 provenances was analyzed. UPGMA clustering analysis was used to divide Z. insignis provenances into different groups.
ResultA total of 151 bands were amplified from 12 primer pairs, and in average 12.58 bands were amplified from each primer pair. There were 106 polymorphic bands, in average 8.83 bands per primer sets, and the average percentage of polymorphic bands was 70.39%. The ratios of polymorphic loci among provenances were 38.96%-72.73%, and 59.66% in average. The genetic diversity indices were 0.175 5-0.313 3, and 0.256 8 in average. The Shannon information indices were 0.249 4-0.450 2, and 0.369 1 in average. The numbers of alleles (na) observed were 1.519 5-1.727 3, and 1.600 0 in average. The number of alleles (na) at the provenance level was 1.724 9. The numbers of effective alleles (ne) were 1.330 5-1.577 3, and 1.4713 in average. The number of effective alleles (ne) at the provenance level was 1.502 6. The genetic identity degrees among provenances were 0.703 1-0.886 5.The genetic distances were 0.120 5-0.352 3. According to cluster analysis, 17 provenances were divided into three groups. The first group included Guangxi and Guizhou provenances. The second group included Guangdong, Hunan and Guangxi provenances. The third group only included Yunnan provenance. The provenances with geographic proximity were generally clustered into the same group.
ConclusionThe genetic diversity is abundant among Z. insignis provenances and among individuals within provenance, but is mainly from individuals within provenance. Therefore more attention should be paid to individuals in genetic improvement of Z. insignis. Both the low level of gene flow among provenances and three clear geographic clustering should be caused by the geographic isolation due to the specific living environment of Z.insignis.
-
Keywords:
- Zenia insignis /
- provenance /
- SRAP /
- genetic diversity
-
广西地处亚热带地区,光热充沛,11月份晚稻收获后农田进入空窗期,利用冬闲田发展马铃薯产业空间大。然而广西冬季雨水偏少,灌水成为制约广西冬种马铃薯产业发展的条件之一。马铃薯实际生产中盲目灌水和过量施肥现象普遍存在,而滴灌施肥可以根据作物需水需肥规律和土壤水分养分状况精确控制灌水量、施肥量和灌水施肥时间,将水分养分直接供应到根区,实现作物“按需灌水施肥”,从而提高作物产量和水分养分利用效率[1],同时滴灌施肥也影响土壤碳组分,因此,研究合适的滴灌施肥模式将为调控土壤碳库提供新的途径。目前常用土壤可溶性有机碳、易氧化有机碳和微生物量碳、碳库管理指数等表征土壤碳库,而水肥管理会影响土壤碳库和酶活性。有研究表明,长期合理施肥显著提高土壤有机碳、易氧化有机碳、可溶性有机碳、微生物量碳含量及碳库管理指数[2],与传统施肥相比,滴灌施肥增加各层次土壤易氧化有机碳和可溶性有机碳含量[3]。其他研究也发现,滴灌施肥对提高土壤易氧化有机碳有积极的作用[4-6]。土壤水分含量影响土壤有机碳矿化速率和外界有机碳分解速率[7],从而使土壤有机碳的含量发生变化。俞华林等[8]发现,适量灌水会增加土壤有机碳含量,但少量或过量灌水降低土壤有机碳矿化速率。当土壤水分过量时,土壤透气性和土壤微生物生长环境变差,土壤中有机碳不易被土壤中的微生物分解,而外界的碳源则易被微生物降解腐烂成有机物质,原有的有机碳不会分解且外源有机碳增加,从而使土壤有机碳含量增加[9]。水肥管理也会影响土壤酶如蔗糖酶、纤维素酶和过氧化氢酶等酶活性,滴灌施肥有利于提高土壤中酶活性[10],而土壤酶活性会影响土壤碳组分。研究发现,各种形态有机碳组分与土壤蔗糖酶和纤维素酶活性均呈显著的正相关关系[11]。
近年来国内外学者较多关注滴灌施肥对马铃薯生长、产量、品质和水分利用效率的影响,而滴灌灌水量和滴灌施肥比例协同作用对种植马铃薯土壤碳库管理指数的影响研究较少,且土壤酶活性如何影响土壤有机碳组分和碳库管理指数有待深入研究。因此,在南宁市防雨棚内开展不同滴灌灌水量和滴灌施肥比例的田间试验,通过测定马铃薯收获后土壤有机碳及活性组分和酶活性,计算土壤碳库管理指数(Carbon pool management index,CPMI),分析土壤有机碳组分和碳库管理指数与酶活性之间的关系,以获得种植马铃薯土壤有机碳库调控的水肥管理模式,并揭示土壤酶活性对土壤有机碳组分和碳库管理指数的影响。
1. 材料与方法
1.1 试验地点与材料
田间试验在南宁市广西大学校内移动防雨棚中进行,该移动棚通风、透光,可以保障作物生长期间自然光照和温度,通过电控传感器在降雨时遮盖,非降雨时移开。供试土壤为赤红壤,pH6.60(水土质量比2.5∶1.0,pH计法),有机质10.6 g·kg−1(重铬酸钾容量法–外加热法),全氮0.99 g·kg−1(半微量开氏法),碱解氮53.6 mg·kg−1(NaOH碱解扩散法),速效磷68.7 mg·kg−1[0.05 mol·L−1 HCl–0.025 mol·L−1 H2SO4浸提,比色法],速效钾217.9 mg·kg−1(1 mol·L−1中性NH4OAc浸提,火焰光度法),田间持水量30.5%(环刀法),容重1.4 g·cm−3(室内环刀法)[12]。供试马铃薯品种为费乌瑞它。
1.2 试验方法
依据马铃薯在不同时期的需水规律及前人研究结果[13-14],试验设高、低2种滴灌灌水量,其中,高灌水量:苗期、块茎形成期、块茎膨大期和淀粉积累期土壤含水量分别保持在田间持水量的60%~70%、70%~80%、75%~85%和50%~60%;低灌水量:苗期、块茎形成期、块茎膨大期和淀粉积累期土壤含水量分别保持在田间持水量的50%~60%、60%~70%、70%~80%和40%~50%。设3种滴灌施肥比例,即NK100-0:N、K肥以100%作基肥土施,不追肥;NK70-30:N、K肥以70%作基肥土施,30%作滴灌追肥(苗期7.5%,块茎形成期15%,块茎膨大期7.5%);NK50-50:N、K肥以50%作基肥土施,50%作滴灌追肥(苗期12.5%,块茎形成期25%,块茎膨大期12.5%)。试验共设6个处理,具体如表1所示,每个处理重复3次,共18个小区,每小区面积8.64 m2(3.6 m×2.4 m)。
表 1 田间试验处理及N、K肥的基、追肥比例Table 1. Treatments for field experiment and radio of base fertilizer and topdressing for N,K fertilizer处理
Treatment滴灌灌水量
Drip irrigation amount滴灌施肥比例
Fertigation ratio基肥/%
Base fertilizer追肥 Topdressing/% 苗期
Seedling stage块茎形成期
Tuber formation stage块茎膨大期
Tuber expansion stageT1 高灌水量
High irrigation amountNK100-0 100 0 0 0 T2 NK70-30 70 7.5 15 7.5 T3 NK50-50 50 12.5 25 12.5 T4 低灌水量
Low irrigation amountNK100-0 100 0 0 0 T5 NK70-30 70 7.5 15 7.5 T6 NK50-50 50 12.5 25 12.5 各小区均施用化学肥料N 150 kg·hm−2、P2O5 90 kg·hm−2和K2O 300 kg·hm−2,以及堆沤后牛粪15 t·hm−2。氮肥用尿素[w(N)为 46.4%],磷肥用钙镁磷肥[w(P2O5)为18.0%],钾肥用硫酸钾[w(K2O)为52.0%]。牛粪中养分:w(有机质)为14.3%、w(N)为0.76%、w(P2O5)为0.85%、w(K2O)为0.59%。牛粪和钙镁磷肥全部做基肥土施。灌溉方式采用地表滴灌,滴头流量一致,滴头设在马铃薯植株两侧,用水表计量灌水。N肥和K肥按上述施肥方式施用,事先按设计要求配好肥料溶液,通过滴灌带进行灌溉施肥,灌溉方法采用交替滴灌。
1.3 田间试验及管理
于2017年11月4日将沤熟牛粪施入试验小区,11月5日翻地,11月10日将部分尿素、钙镁磷肥以及硫酸钾作为基肥土施。11月11日切马铃薯块茎,每个种薯块茎留2~3个芽眼,用质量分数为0.5%的高锰酸钾溶液和丁硫克百威水溶液浸泡拌种后晾干,11月14日播种,12月4日移栽或补齐未发芽位置的马铃薯苗。用TRIME-PICO-IPH TDR水分测定仪(德国IMKO)测定土壤含水量,确保土壤含水量在试验设定范围内。12月6日施苗肥,12月11日进行第一次中耕培土。12月20日施块茎形成肥,12月25日进行第2次培土(培土到植株附近,芽块顶部到垄背顶部达到15~20 cm左右,做成梯形垄)。2018年1月4日,施块茎膨大肥,2月8日喷农药(棉铃虫核型多角体病毒,预防马铃薯晚疫病),试验于2018年3月5日收获马铃薯。
1.4 土壤样品采集与测定
于3月6日(马铃薯收获后次日)用5点法在马铃薯相邻植株中间采集0~20 cm耕作层土壤,将土样混匀,迅速运回实验室,部分新鲜土样过孔径2 mm筛网,除去根系、砂石等后,保存于4 ℃冰箱,直接用于土壤有机碳组分和酶活性的测定。剩余土样风干后过0.149 mm筛后进行土壤总有机碳含量的测定。
土壤总有机碳(Total organic carbon,TOC)含量用高温外加热重铬酸钾氧化–容量法测定[12];活性有机碳(Labile organic carbon,LOC)含量用浓度为333 mmol·L−1的高锰酸钾溶液氧化土样,并于565 nm下通过测定光密度得到[12];微生物量碳(Microbial biomass carbon,MBC)和可溶性有机碳(Dissolved organic carbon,,DOC)含量分别用三氯甲烷熏蒸和不用三氯甲烷熏蒸后,用浓度为0.5 mol·L−1硫酸钾溶液提取,采用高温外加热重铬酸钾氧化–容量法测定[12]。
土壤蔗糖酶活性用3,5–二硝基水杨酸溶液比色法测定,其活性以1 g干土1 d生成葡萄糖的质量(mg)表示;纤维素酶活性也用3,5–二硝基水杨酸溶液比色法测定,以1 g干土3 d生成葡萄糖的质量(mg)表示1个活性单位(U);过氧化氢酶活性用高锰酸钾滴定法测定,其活性以1 g干土消耗浓度为0.02 mol·L−1的KMnO4溶液体积(mL)表示,3种酶活性测定的具体操作步骤见《土壤酶及其研究法》[15]。
土壤碳库指数(Carbon pool index,CPI)和碳库管理指数的计算参照杜爱林等[16]的方法进行。
1.5 数据统计分析
试验数据采用Excel 2016和SPSS 24.0软件进行分析。方差分析包括滴灌灌水量和滴灌施肥比例主效应,以及它们之间的交互效应。用Duncan’s法对不同处理进行多重比较。用Pearson相关系数表示土壤总有机碳及其组分和碳库管理指数与酶活性之间的相关性。
2. 结果与分析
2.1 不同水肥处理对土壤有机碳及其组分的影响
由表2方差分析可知,滴灌灌水量和滴灌施肥。比例对土壤总有机碳(TOC)影响显著(P<0.05)。土壤TOC质量分数在5.46~7.12 g·kg−1之间。多重比较结果显示,相同滴灌施肥比例下,高灌水量土壤TOC含量显著高于低灌水量土壤。在高灌水量下,NK50-50施肥处理土壤TOC含量分别比NK100-0和NK70-30处理提高15.2%和7.1%。在低灌水量下,NK50-50施肥处理土壤TOC含量比NK100-0和NK70-30处理提高12.6%和9.8%。
表 2 不同处理对土壤有机碳及其组分的影响1)Table 2. Effects of different treatments on soil organic carbon and its components处理
Treatment滴灌灌水量
Drip irrigation amount滴灌施肥比例
Fertigation ratiow/(g·kg−1) w/(mg·kg−1) 总有机碳
Total organic carbon(TOC)活性有机碳
Labile organic carbon(LOC)可溶性有机碳
Dissolved organic carbon(DOC)微生物量碳
Microbial biomass carbon(MBC)T1 高灌水量
High irrigation amountNK100-0 6.18±0.15bc 0.44±0.03b 323.0±57.0ab 374.8±25.3ab T2 NK70-30 6.65±0.24ab 0.49±0.01b 369.5±27.5a 384.8±20.3a T3 NK50-50 7.12±0.24a 0.55±0.02a 328.7±14.8ab 370.6±3.1b T4 低灌水量
Low irrigation amountNK100-0 5.46±0.15d 0.43±0.01b 189.5±49.8b 325.8±8.5b T5 NK70-30 5.60±0.16cd 0.44±0.01b 241.3±93.5ab 343.0±9.6ab T6 NK50-50 6.15±0.18bc 0.47±0.01b 215.6±7.6ab 324.1±18.7b 显著性检验
(P值)
Significance test
(P value)滴灌灌水量 Drip irrigation amount 0.004 0.008 0.011 0.005 滴灌施肥比例 Fertigation ratio 0.001 0.003 0.626 0.567 滴灌灌水量×滴灌施肥比例
Drip irrigation amount × Fertigation ratio0.674 0.125 0.979 0.975 1) 同列数据后的不同小写字母表示处理间差异显著 (P<0.05,Duncan’s法)
1) Different lowercase letters in the same column indicate significant differences among treatments (P<0.05,Duncan’s test)滴灌灌水量和滴灌施肥比例对土壤活性有机碳(LOC)影响显著(P<0.05)(表2)。土壤LOC质量分数介于0.43~0.55 g·kg−1之间。NK50-50下,高灌水量土壤LOC含量显著高于低灌水量土壤。高灌水量下,NK50-50处理土壤LOC含量较NK100-0增加25.0%,且差异显著,而在低灌水量下,不同滴灌施肥比例土壤LOC含量之间的差异并不显著。
滴灌灌水量对于土壤可溶性有机碳(DOC)影响显著(P<0.05)(表2)。土壤DOC质量分数介于189.5~369.5 mg·kg−1之间。相同滴灌施肥比例下,高灌水量土壤DOC含量与低灌水量土壤之间的差异不显著,相同滴灌灌水量下,不同滴灌施肥比例土壤DOC含量之间的差异也不显著。低灌水量下,NK70-30土壤DOC含量比NK100-0高27.3%。
滴灌灌水量对土壤微生物量碳(MBC)影响显著(P<0.05)(表2)。土壤MBC质量分数在324.1~384.8 mg·kg−1之间。相同滴灌施肥比例下,高灌水量土壤MBC含量与低灌水量土壤MBC含量之间的差异不显著;相同滴灌灌水量下,不同滴灌施肥比例土壤MBC含量之间的差异也不显著。
此外,滴灌灌水量和滴灌施肥比例之间的交互作用对土壤TOC、LOC、DOC和MBC含量的影响均不显著(P>0.05)。T3处理土壤TOC和LOC含量相对较高,而T2处理土壤DOC和MBC含量相对较高。在相同滴灌施肥比例下,高灌水量土壤有机碳及其组分较低灌水量土壤高。
2.2 不同水肥处理对土壤酶活性的影响
由表3方差分析可知,滴灌灌水量对土壤蔗糖酶活性影响显著(P<0.05),但滴灌施肥比例和滴灌灌水量×滴灌施肥比例对土壤蔗糖酶活性的影响并不显著(P>0.05)。多重比较结果显示,NK100-0和NK50-50下,高灌水量土壤蔗糖酶活性较相应低灌水量土壤分别提高18.9%和18.2%,但差异不显著。土壤蔗糖酶活性以T3处理较高。
表 3 不同处理对土壤酶活性的影响1)Table 3. Effects of different treatments on soil enzyme activity处理
Treatment滴灌灌水量
Drip irrigation amount滴灌施肥比例
Fertigation ratio蔗糖酶活性/(mg·g−1·d−1)
Sucrase activity纤维素酶活性/U
Cellulase activity过氧化氢酶活性/(mL·g−1)
Catalase activityT1 高灌水量
High irrigation amountNK100-0 7.17±0.36ab 0.73±0.06a 0.45±0.03a T2 NK70-30 7.29±0.14a 0.75±0.04a 0.47±0.03a T3 NK50-50 7.39±0.24a 0.75±0.03a 0.46±0.02a T4 低灌水量
Low irrigation amountNK100-0 6.03±0.56b 0.64±0.06a 0.39±0.06a T5 NK70-30 6.30±0.18ab 0.67±0.06a 0.45±0.04a T6 NK50-50 6.25±0.44ab 0.66±0.03a 0.44±0.04a 显著性检验
(P值)
Significance
Test
(Pvalue)滴灌灌水量 Drip irrigation amount 0.003 0.062 0.311 滴灌施肥比例 Fertigation ratio 0.799 0.906 0.602 滴灌灌水量×滴灌施肥比例
Drip irrigation amount × Fertigation ratio0.969 0.999 0.873 1)同列数据后的不同小写字母表示处理间差异显著 (P<0.05,Duncan’s法)
1) Different lowercase letters in the same column indicate significant differences among treatments (P<0.05,Duncan’s test)滴灌灌水量、滴灌施肥比例以及滴灌灌水量×滴灌施肥比例对土壤纤维素酶和过氧化氢酶活性的影响均不显著(P>0.05)(表3)。各处理土壤纤维素酶和过氧化氢酶活性之间的差异不显著。
2.3 不同水肥处理对土壤碳库管理指数的影响
由表4方差分析可知,滴灌灌水量对土壤碳库指数影响显著(P<0.05),但对碳库管理指数(CPMI)影响不显著(P>0.05)。滴灌施肥比例对土壤CPI和CPMI影响均不显著(P>0.05)。滴灌灌水量×滴灌施肥比例对土壤CPI和CPMI均有显著影响(P<0.05)。
在相同滴灌施肥比例下,高灌水量土壤CPI和CPMI均高于低灌水量土壤。高灌水量下,NK50-50施肥处理土壤的CPI和CPMI比NK100-0分别提高15.1%和25.8%;低灌水量下,NK50-50施肥处理土壤的CPI和CPMI比NK100-0分别提高12.6%和8.4%。土壤CPI和CPMI以T3处理最高。
2.4 土壤有机碳及其组分和碳库管理指数与酶活性之间的相互关系
土壤有机碳及其组分和碳库管理指数与酶活性之间的相关性分析结果如表5所示。土壤TOC、DOC、MBC和CPI均与蔗糖酶活性之间呈显著正相关(相关系数分别为0.61,0.48,0.46和0.60),而土壤碳库指数与其他2种酶活性之间的相关性均不显著。
表 4 不同处理对土壤碳库管理指数的影响1)Table 4. Effects of different treatments on soil carbon pool management index处理
Treatment滴灌灌水量
Drip irrigation amount滴灌施肥比例
Fertigation ratio碳库指数
Carbon pool index
(CPI)碳库管理指数
Carbon pool management index
(CPMI)T1 高灌水量
High irrigation amountNK100-0 1.26±0.03bc 121.65±7.57b T2 NK70-30 1.35±0.05ab 134.36±4.23b T3 NK50-50 1.45±0.05a 153.04±5.71a T4 低灌水量
Low irrigation amountNK100-0 1.11±0.03d 120.08±4.93b T5 NK70-30 1.14±0.03cd 122.43±4.23b T6 NK50-50 1.25±0.04bc 130.19±2.63b 显著性检验
(P值)
Significance test
(P value)滴灌灌水量 Drip irrigation amount 0.001 0.111 滴灌施肥比例 Fertigation ratio 0.113 0.194 滴灌灌水量×滴灌施肥比例
Drip irrigation amount × Fertigation ratio0.000 0.001 1)同列数据后的不同小写字母表示处理间差异显著(P<0.05,Duncan’s法)
1)Different lowercase letters in the same column indicate significant differences among treatments (P<0.05,Duncan’s test)表 5 土壤有机碳及其组分含量和碳库管理指数与酶活性的相关性分析1)Table 5. Correlation analyses of soil organic carbon and fraction contents and carbon pool management index with enzyme activity指标
Index蔗糖酶
Sucrase纤维素酶
Cellulase过氧化氢酶
Catalase总有机碳 Total organic carbon (TOC) 0.61** 0.24 0.33 活性有机碳 Labile organic carbon (LOC) 0.29 0.23 0.14 可溶性有机碳 Dissolved organic carbon (DOC) 0.48* 0.02 0.29 微生物量碳 Microbial biomass carbon (MBC) 0.46* 0.29 0.03 碳库指数 Carbon pool index (CPI) 0.60** 0.24 0.31 碳库管理指数 Carbon pool management index (CPMI) 0.23 0.24 0.20 1)“*”和“**”分别表示达0.05和0.01水平的显著相关(n=3,Pearson法)
1)“*” and “**” indicate significant correlations at 0.05 and 0.01 levels, respectively(n=3, Pearson method)3. 讨论与结论
本研究表明,在相同滴灌灌水量下,与NK100-0相比,NK50-50和NK70-30滴灌施肥下的土壤TOC、LOC和DOC含量都有所提高。NK100-0处理土壤总有机碳及其组分含量等都较低,原因是该处理的肥料全部用作基肥施入土壤,后期养分供应不足,而且部分N肥易通过挥发或反硝化损失,影响N肥施用效果。而NK50-50和NK70-30交替灌溉追施N、K肥使两侧根区土壤处于交替干燥和湿润状态,在提供作物所需水分和养分的同时,使根区土壤处于良好的通气状态,为土壤微生物提供了有益的生存条件,故交替滴灌施肥比例的增加有利于土壤有机碳组分的增加[17];再加上在马铃薯成熟期化学N、K肥配施能够促进作物根系生长,通过增加地下生物量来提高土壤有机质含量,进而有助于有机碳及其组分的增加[18]。
本研究表明,滴灌灌水量对于土壤有机碳及其组分的影响都达到显著水平。在相同滴灌施肥比例下,高灌水量土壤TOC、LOC、DOC和MBC含量都高于低灌水量土壤。相关研究发现,土壤含水量从土壤含水量<50%变成50%~100%时,土壤微生物活性通常会受到抑制,使土壤有机碳矿化分解缓慢,进而使土壤有机碳及其组分增加[19]。
土壤碳库管理指数作为反映土壤碳素动态变化灵敏而有效的指标,与土壤有效碳的关系密切,可反映和评估土壤碳素动态变化[20]。土壤碳库管理指数可用于衡量土壤质量,CPMI值越大,表明土壤质量越好[21]。本研究表明,在相同的灌水量下,NK50-50施肥处理土壤的CPI和CPMI均高于NK100-0,说明提高滴灌施肥比例会增加土壤CPMI,这与滕秋梅等[22]和张鹏等[23]的研究结果一致。说明适量N、K肥的加入可促进植物生长,增强土壤养分循环功能。究其原因,可能是N、K肥施入后主要提高的是LOC含量,导致碳库管理指数较高。凋落物和根系分泌物转化为有机质时,一部分有机质活化后为植物生长提供养分,一部分有机质转化为惰性碳库固存下来,这2个比例维持在一定范围内[24]。
土壤酶在土壤养分周转及土壤功能稳定中有重要作用。在影响土壤酶活性因子中,土壤水分对酶活性的影响具有异质性。本研究表明,土壤蔗糖酶活性在高灌水量下较高,说明灌水量的增加会提高土壤蔗糖酶活性,这与田幼华等[25]、高丽敏等[26]研究结果一致,但与万忠梅等[27]的研究结果相反,这可能是由于不同作物的需水量不同。而本研究结果可能是因为土壤水分的增加,加快了微生物胞外酶和底物的运输速率,可为酶促反应提供良好的反应环境,进而蔗糖酶和纤维素酶活性得到提高[28]。但滴灌施肥比例对土壤蔗糖酶、纤维素酶、过氧化氢酶活性的影响不显著,这与大多数研究结果并不相同。这可能是由于本研究是在相同的施肥量下,滴灌施肥比例对各种酶活性的影响较小;而大多数研究是通过设置不同的施肥梯度实现的。
蔗糖酶对蔗糖分解的催化作用具有专一性,能将土壤中蔗糖分子分解成果糖和葡萄糖,为土壤微生物提供营养物质,促进土壤有机碳积累与分解转化,从而直接或者间接地影响有机碳矿化过程[29]。本研究表明,土壤总有机碳与蔗糖酶活性呈极显著正相关,以往研究也有相似的结果[30],说明土壤蔗糖酶活性影响土壤有机碳的积累。本研究发现,土壤有机碳组分与纤维素酶和过氧化氢酶活性之间的关系不显著,然而,马瑞萍等[11]对黄土高原不同植物群落土壤团聚体中有机碳和酶活性研究表明,土壤纤维素酶活性与各种组分有机碳之间的关系均呈显著正相关。张英英[31]研究发现,不同耕作措施下甘肃旱地农田0~30 cm土层土壤活性有机碳与纤维素酶和过氧化物酶活性之间的关系呈显著正相关,与本试验结果不同,可能是试验条件和土壤类型不同的原因所致。
综上所述,在高灌水量(苗期、块茎形成期、块茎膨大期和淀粉积累期土壤含水量分别保持在田间持水量的60%~70%、70%~80%、75%~85%和50%~60%)和NK50-50施肥处理(N、K肥以50%作基肥土施,50%作滴灌追肥)下土壤总有机碳及其组分、蔗糖酶活性和碳库管理指数较高,因此,高灌水量和N、K肥基、追肥比50∶50处理为广西冬种马铃薯种植土壤有机碳库调控的水肥耦合模式。此外,土壤TOC、DOC、MBC含量和CPI均与蔗糖酶活性呈显著正相关,说明土壤蔗糖酶活性会影响土壤有机碳及其组分。
-
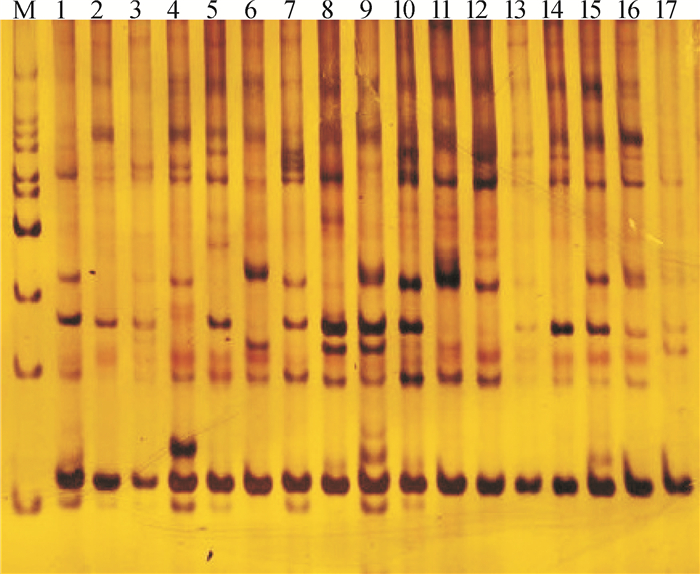
![]()
图 1 各种源任豆SRAP引物扩增结果
M:100 bp DNA ladder;任豆种源分别为1:广西靖西;2:广西都安;3:广西罗城;4:广西桂林;5:广东阳山;6:湖南江华;7:广西灵川;8:湖南通道;9:广西德保;10:广西平果;11:广西那坡;12:贵州册亨;13:云南西畴;14:云南麻栗坡;15:贵州梵净山;16:贵州罗甸;17:广东乐昌。
Figure 1. Amplified results of SRAP primers
![]()
图 2 任豆种源UPGMA聚类图
Figure 2. Dendrogram based on genetic distances among Zenia insignis from different provenances
表 1 任豆采种点地理位置
Table 1 Geographic location of different seed collection sites of Zenia insignis
编号 种源 经度(E)/(°) 纬度(N)/(°) 1 广西靖西 113.08 24.80 2 广西都安 108.09 23.94 3 广西罗城 108.91 24.79 4 广西桂林 109.60 24.25 5 广东阳山 112.64 24.48 6 湖南江华 111.79 24.97 7 广西灵川 110.45 25.07 8 湖南通道 109.88 26.26 9 广西德保 106.61 23.35 10 广西平果 107.59 23.33 11 广西那坡 106.01 23.38 12 贵州册亨 105.80 24.98 13 云南西畴 104.67 23.43 14 云南麻栗坡 104.71 23.12 15 贵州梵净山 108.78 27.83 16 贵州罗甸 106.41 25.72 17 广东乐昌 112.85 25.52  下载: 导出CSV
表 2 任豆SRAP分析的引物序列
Table 2 Primer sequences used for SRAP analysis of Zenia insignis
引物编号 正向序列 引物编号 反向序列 Me1 5′TGA GTA CAA ACC GG ATA 3′ Em1 5′GAC TGC GTA CGA ATT TGC 3′ Me2 5′TGA GTA CAA ACC GG AGC 3′ Em2 5′GAC TGC GTA CGA ATT TGC 3′ Me3 5′TGA GTA CAA ACC GG AAT 3′ Em3 5′GAC TGC GTA CGA ATT GAC 3′ Me4 5′TGA GTA CAA ACC GG ACC 3′ Em4 5′GAC TGC GTA CGA ATT TGA 3′ Me5 5′TGA GTA CAA ACC GG AAG 3′ Em5 5′GAC TGC GTA CGA ATT AAC 3′ Me6 5′TGA GTA CAA ACC GG TAA 3′ Em6 5′GAC TGC GTA CGA ATT GCA 3′ Me7 5′TGA GTA CAA ACC GG TCC 3′ Em7 5′GAC TGC GTA CGA ATT GAG 3′ Me8 5′TGA GTA CAA ACC GG TGC 3′ Em8 5′GAC TGC GTA CGA ATT GCC 3′ Me9 5′TGA GTA CAA ACC GG ACA 3′ Em9 5′GAC TGC GTA CGA ATT TCA 3′ Me10 5′TGA GTA CAA ACC GG ACG 3′ Em10 5′GAC TGC GTA CGA ATT CAA 3′ Me11 5′TGA GTA CAA ACC GG ACT 3′ Em11 5′GAC TGC GTA CGA ATT GCA 3′ Me12 5′TGA GTA CAA ACC GG AGG 3′ Em12 5′GAC TGC GTA CGA ATT CAT 3′ Me13 5′TGA GTA CAA ACC GG AAA 3′ Em13 5′GAC TGC GTA CGA ATT CTA 3′ Me14 5′TGA GTA CAA ACC GG AAC 3′ Em14 5′GAC TGC GTA CGA ATT CTC 3′ Me15 5′TGA GTA CAA ACC GG AGA 3′ Em15 5′GAC TGC GTA CGA ATT CTT 3′ Me16 5′TGA GTA CAA ACC GG ATA 3′ Em16 5′GAC TGC GTA CGA ATT GAT 3′ Me17 5′TGA GTA CAA ACC GG TAG 3′ Em17 5′GAC TGC GTA CGA ATT ATG 3′ Me18 5′TGA GTA CAA ACC GG CAT 3′ Em18 5′GAC TGC GTA CGA ATT AGC 3′ Me19 5′TGA GTA CAA ACC GG TTG 3′ Em19 5′GAC TGC GTA CGA ATT ACG 3′ Me20 5′TGA GTA CAA ACC GG TGT 3′ Em20 5′GAC TGC GTA CGA ATT TAG 3′ Me21 5′TGA GTA CAA ACC GG TCA 3′ Em21 5′GAC TGC GTA CGA ATT TCG 3′ Me22 5′TGA GTA CAA ACC GG GCA 3′ Em22 5′GAC TGC GTA CGA ATT GTC 3′ Me23 5′TGA GTC CAA ACC GG ATG 3′ Em23 5′GAC TGC GTA CGA ATT GGT 3′ Me24 5′TGA GTC CAA ACC GG GAT 3′ Em24 5′GAC TGC GTA CGA ATT CAG 3′ Me25 5′TGA GTC CAA ACC GG GCT 3′ Em25 5′GAC TGC GTA CGA ATT CTG 3′ Me26 5′TTC AGG GTG GCC GG ATG 3′ Em26 5′GAC TGC GTA CGA ATT CGG 3′ Me27 5′TGG GGA CAA CCC GG CTT 3′ Em27 5′GAC TGC GTA CGA ATT CCA 3′
下载: 导出CSV
表 3 任豆不同引物组合的多态性条带
Table 3 Polymorphic bands of different primer combinations of Zenia insignis
引物组合 多态性条带数量 多态性条带占比/% Me8/Em5 10 66.67 Me9/Em6 8 61.54 Me2/Em9 9 69.23 Me3/Em9 8 66.67 Me7/Em10 10 76.92 Me9/Em14 9 81.18 Me17/Em14 10 76.92 Me2/Em15 6 66.67 Me2/Em16 10 74.42 Me1/Em17 7 58.34 Me24/Em21 11 73.33 Me16/Em21 8 72.73 平均值 8.83 70.39
下载: 导出CSV
表 4 不同种源任豆的多态位点
Table 4 Polymorphic loci for Zenia insignis from different provenances
种源 多态位点数 多态位点比率/% 广西靖西 75 58.44 广西都安 77 61.04 广西罗城 77 61.04 广西桂林 84 70.13 广东阳山 77 61.04 湖南江华 72 54.55 广西灵川 60 38.96 湖南通道 71 53.25 广西德保 73 55.84 广西平果 75 58.44 广西那坡 78 62.34 贵州册亨 86 72.73 云南西畴 80 64.94 云南麻栗坡 78 62.34 贵州梵净山 70 51.95 贵州罗甸 77 61.04 广东乐昌 81 66.23 平均值 75.8 59.66
下载: 导出CSV
表 5 各种源任豆的遗传多样性
Table 5 Genetic diversities in Zenia insignis from different provenances
种源 观测等位基因数(na) 有效等位基因数(ne) 基因多样性指数(h) Shannon信息指数(I) 广西靖西 1.584 4 1.488 9 0.260 8 0.371 5 广西都安 1.610 4 1.486 3 0.263 6 0.378 6 广西罗城 1.610 4 1.445 4 0.249 0 0.362 6 广西桂林 1.701 3 1.573 0 0.308 0 0.440 5 广东阳山 1.610 4 1.486 3 0.263 6 0.378 6 湖南江华 1.545 5 1.424 4 0.232 0 0.334 4 广西灵川 1.389 6 1.330 5 0.175 5 0.249 4 湖南通道 1.532 5 1.459 8 0.242 7 0.344 1 广西德保 1.558 4 1.457 3 0.245 6 0.351 2 广西平果 1.584 4 1.447 9 0.246 1 0.355 6 广西那坡 1.623 4 1.491 9 0.267 5 0.384 8 贵州册亨 1.727 3 1.577 3 0.313 3 0.450 2 云南西畴 1.649 4 1.482 5 0.268 0 0.389 2 云南麻栗坡 1.623 4 1.478 2 0.262 6 0.379 5 贵州梵净山 1.519 5 1.379 2 0.211 9 0.308 7 贵州罗甸 1.610 4 1.506 8 0.271 0 0.386 5 广东乐昌 1.662 3 1.522 2 0.284 1 0.408 7 种源间 1.724 9 1.502 6 0.285 8 0.418 6
下载: 导出CSV
表 6 任豆种源间的遗传一致度和遗传距离1)
Table 6 Genetic identity degrees and genetic distances between Zenia insignis from different provenances
种源 1 2 3 4 5 6 7 8 9 10 11 12 13 14 15 16 17 1 0.847 2 0.838 4 0.733 6 0.755 5 0.746 7 0.803 5 0.807 9 0.825 3 0.847 2 0.825 3 0.768 6 0.746 7 0.720 5 0.790 4 0.803 5 0.742 4 2 0.165 9 0.886 5 0.799 1 0.759 8 0.812 2 0.764 2 0.794 8 0.829 7 0.834 1 0.812 2 0.799 1 0.716 2 0.716 2 0.794 8 0.807 9 0.772 9 3 0.176 2 0.120 5 0.842 8 0.751 1 0.829 7 0.772 9 0.768 6 0.821 0 0.834 1 0.855 9 0.799 1 0.742 4 0.716 2 0.777 3 0.755 5 0.755 5 4 0.309 8 0.224 2 0.171 0 0.777 3 0.803 5 0.764 2 0.751 1 0.742 4 0.755 5 0.812 2 0.816 6 0.733 6 0.716 2 0.768 6 0.729 3 0.772 9 5 0.280 4 0.274 7 0.286 2 0.251 9 0.860 3 0.777 3 0.799 1 0.755 5 0.768 6 0.738 0 0.751 1 0.807 9 0.816 6 0.781 7 0.733 6 0.864 6 6 0.292 1 0.208 0 0.186 7 0.218 8 0.150 5 0.794 8 0.825 3 0.772 9 0.812 2 0.772 9 0.777 3 0.764 2 0.799 1 0.799 1 0.742 4 0.812 2 7 0.218 8 0.268 9 0.257 6 0.268 9 0.251 9 0.229 7 0.847 2 0.794 8 0.738 0 0.733 6 0.738 0 0.707 4 0.724 9 0.794 8 0.790 4 0.764 2 8 0.213 4 0.229 7 0.263 2 0.286 2 0.224 2 0.192 0 0.165 9 0.807 9 0.777 3 0.720 5 0.794 8 0.738 0 0.755 5 0.790 4 0.794 8 0.803 5 9 0.192 0 0.186 7 0.197 3 0.297 9 0.280 4 0.257 6 0.229 7 0.213 4 0.855 9 0.772 9 0.777 3 0.703 1 0.738 0 0.799 1 0.794 8 0.803 5 10 0.165 9 0.181 4 0.181 4 0.280 4 0.263 2 0.208 0 0.303 8 0.251 9 0.155 6 0.855 9 0.764 2 0.716 2 0.716 2 0.786 0 0.807 9 0.790 4 11 0.192 0 0.208 0 0.155 6 0.208 0 0.303 8 0.257 6 0.309 8 0.327 8 0.257 6 0.155 6 0.803 5 0.746 7 0.720 5 0.738 0 0.759 8 0.724 9 12 0.263 2 0.224 2 0.224 2 0.202 6 0.286 2 0.251 9 0.303 8 0.229 7 0.251 9 0.268 9 0.218 8 0.794 8 0.733 6 0.794 8 0.807 9 0.772 9 13 0.292 1 0.333 9 0.297 9 0.309 8 0.213 4 0.268 9 0.346 1 0.303 8 0.352 3 0.333 9 0.292 1 0.229 7 0.886 5 0.746 7 0.742 4 0.768 6 14 0.327 8 0.333 9 0.333 9 0.333 9 0.202 6 0.224 2 0.321 7 0.280 4 0.303 8 0.333 9 0.327 8 0.309 8 0.120 5 0.790 4 0.742 4 0.777 3 15 0.235 2 0.229 7 0.251 9 0.263 2 0.246 3 0.224 2 0.229 7 0.235 2 0.224 2 0.240 8 0.303 8 0.229 7 0.292 1 0.235 2 0.847 2 0.777 3 16 0.218 8 0.213 4 0.280 4 0.315 7 0.309 8 0.297 9 0.235 2 0.229 7 0.229 7 0.213 4 0.274 7 0.213 4 0.297 9 0.297 9 0.165 9 0.781 7 17 0.297 9 0.257 6 0.280 4 0.257 6 0.145 5 0.208 0 0.268 9 0.218 8 0.218 8 0.235 2 0.321 7 0.257 6 0.263 2 0.251 9 0.251 9 0.246 3 1) 对角线上方为遗传一致度,对角线下方为遗传距离;任豆种源分别为1:广西靖西, 2:广西都安, 3:广西罗城, 4:广西桂林, 5:广东阳山, 6:湖南江华, 7:广西灵川, 8:湖南通道, 9:广西德保, 10:广西平果, 11:广西那坡, 12:贵州册亨, 13:云南西畴, 14:云南麻栗坡, 15:贵州梵净山, 16:贵州罗甸, 17:广东乐昌。
下载: 导出CSV
-
[1] 何小勇. 翅荚木种源遗传多样性及其抗低温胁迫能力研究[D]. 长沙: 中南林业大学, 2007. http://cdmd.cnki.com.cn/Article/CDMD-10538-1011063668.htm [2] 陈永密.珍稀树种:翅荚木[M].福州:福建教育出版社, 1989. [3] 侯伦灯, 李玉曹, 李平宇, 等.任豆树综合利用研究[J].林业科学, 2010, 37(3):139-143. doi: 10.11707/j.1001-7488.20100322 [4] 范霭萱, 梁兆彦, 宋喜宣.可开发的木本饲料[J].广西畜牧兽医, 1995, 11(2):20-23. http://www.cnki.com.cn/Article/CJFDTOTAL-ZGLY701.025.htm [5] 郑学项, 冯素萍, 李维国. DNA分子标记研究进展[J].安徽农业科学, 2009, 37(26):12420-12422. doi: 10.3969/j.issn.0517-6611.2009.26.026 [6] 陈丽君, 刘明骞, 廖柏勇, 等.苦楝SRAP-PCR反应体系的建立及优化[J].华南农业大学学报, 2015, 36(3):104-108. doi: 10.7671/j.issn.1672-0202.2015.03.011 [7] LI G, QUIROS C F. Sequence-related amplified polymorphism (SRAP), a new marker system based on a simple PCR reaction: Its application to mapping and gene tagging in Brassica [J]. Theor Appl Genet, 2001, 103(103):455-461. doi: 10.1007/s001220100570
[8] NEI M. Molecular evolutionary genetics[M]. New York: Columbia University Press, 1987.
[9] MANTEL N. The detection of disease clustering and a generalized regression approach[J]. Cancer Res, 1967, 27(2):209-220. http://cancerres.aacrjournals.org/content/27/2_Part_1/209?cited-by=yesl27/2_Part_1/209
[10] 沈俊岭, 倪慧群, 陈晓阳, 等.麻疯树遗传多样性的相关序列扩增多态性(SRAP)分析[J].浙江林学院学报, 2010, 27(3):347-353. http://www.cnki.com.cn/Article/CJFDTOTAL-ZJLX201003007.htm [11] 祝全东, 张党权, 李晓云, 等.油茶SRAP标记的PCR体系建立与优化[J].中南林业科技大学学报, 2010, 30(3):57-62. http://www.cnki.com.cn/Article/CJFDTOTAL-ZNLB201003013.htm [12] 谭碧玥, 王源秀, 徐立安.杨树基因组SRAP扩增体系的建立与优化[J].林业科技开发, 2009, 23(2):25-29. http://www.cnki.com.cn/Article/CJFDTOTAL-LKKF200902009.htm [13] 徐斌, 张方秋, 潘文, 等.我国红锥天然群体的遗传多样性和遗传结构[J].林业科学, 2013, 49(10):162-166. http://www.cnki.com.cn/Article/CJFDTOTAL-LYKE201310025.htm [14] 黄勇.基于SRAP分子标记的小果油茶遗传多样性分析[J].林业科学, 2013, 49(3):43-50. doi: 10.11707/j.1001-7488.20130306 [15] 李楠, 柳新红, 李因刚, 等.白花树天然群体的遗传多样性[J].林业科学, 2012, 48(11):49-56. doi: 10.11707/j.1001-7488.20121108 [16] 王玉山, 邢世岩, 唐海霞, 等.侧柏种源遗传多样性分析[J].林业科学, 2011, 47(2):90-96. http://www.cnki.com.cn/Article/CJFDTOTAL-LYKE201107016.htm [17] 唐琴, 曾秀丽, 廖明安, 等.大花黄牡丹遗传多样性的SRAP分析[J].林业科学, 2012, 48(1):70-76. doi: 10.11707/j.1001-7488.20120112 [18] 刘志远, 范卫红, 沈世华.构树SRAP分子标记[J].林业科学, 2009, 45(12):54-58. doi: 10.11707/j.1001-7488.20091209 [19] HAMRICK J L, GODT M J W, SHERMAN-BRNYES S L. Factors influencing levels of genetic diversity in woody plant species[J].New Forests, 1992, 42(6):95-124. doi: 10.1007/978-94-011-2815-5_7
[20] HAMRICK J L. Isozymes and the analysis of genetic structure in plant populations[C] //SOHIS D E, SOHIS P S.Isozymes in plant biology. London: Chapman and Hall, 1990:87-105. doi: 10.1007/978-94-009-1840-5_5
[21] 刘华波, 王哲, 刘君, 等.燕山山脉西伯利亚杏的遗传多样性和遗传结构[J].林业科学研究, 2012, 48(8):68-74. http://www.cnki.com.cn/Article/CJFDTOTAL-LYKE201208013.htm [22] 郑健, 郑勇奇, 张川红, 等.花楸树天然群体的遗传多样性研究[J].生物多样性, 2008, 16(6): 562-569. http://www.cnki.com.cn/Article/CJFDTOTAL-SWDY200806007.htm [23] 张文标, 金则新, 李钧敏.濒危植物香果树自然居群遗传多样性的RAPD分析[J].浙江大学学报(农业与生命科学版), 2007, 33(1):61-67. http://www.cnki.com.cn/Article/CJFDTOTAL-ZJNY200701010.htm [24] 明军, 顾万春.紫丁香天然群体遗传多样性的AFLP分析[J].园艺学报, 2006, 33(6):1269-1274. http://cpfd.cnki.com.cn/Article/CPFDTOTAL-EGYP200511001131.htm [25] 徐小林, 徐立安, 黄敏仁, 等.栓皮栎天然群体SSR遗传多样性研究[J].遗传, 2004, 26(5):683-688. http://www.cnki.com.cn/Article/CJFDTOTAL-YCZZ200405023.htm -
期刊类型引用(11)
1. 朱士江, 朱子荣, 张友贤, 冯雅婷, 钟韵, 郝琨, 廖龙炎. 灌水量对设施柑橘园土壤温湿度及酶活性的影响. 干旱地区农业研究. 2025(04)  百度学术
百度学术
2. 何玉,周晨莉,张恒嘉. 水氮互作对土壤有机碳、微生物及酶活性的影响研究述评. 水利规划与设计. 2025(03): 97-100+106 . 百度学术
3. 秦钧,骆洪义,贾国燏,褚旭,宋久洋,胡华林. 聚乙烯微塑料对土壤的影响及综合生物标志物响应指数. 山东化工. 2025(03): 12-18 . 百度学术
4. 赵俊波,胡兵辉. 水肥调控对茶树土壤酶及土壤养分的影响. 山西农业大学学报(自然科学版). 2024(02): 130-140 . 百度学术
5. 梁榕,何娇,孙飞虎,张瑞芳,王鑫鑫. 聚乙烯微塑料对土壤养分和酶活性的影响. 环境科学. 2024(06): 3679-3687 . 百度学术
6. 王颜玉,王文定,郑梦瑶,欧行奇,郑会芳. 施氮和灌溉处理对麦田土壤有机碳组分及酶活性的影响. 环境工程技术学报. 2024(05): 1419-1426 . 百度学术
7. 朱琪,史中兴,寇燕燕,刘斌,陈亮,栾倩倩. 原位工程化根治技术和增施生物有机肥对盐碱地土壤酶活性及甜瓜产量、品质的影响. 中国瓜菜. 2023(03): 77-84 . 百度学术
8. 赵朔. 水肥一体化模式对马铃薯干物质积累及水分利用效率的影响. 基层农技推广. 2023(05): 34-37 . 百度学术
9. 郝海波,许文霞,侯振安. 水氮耦合对滴灌棉田土壤有机碳组分及酶活性的影响. 植物营养与肥料学报. 2023(05): 860-875 . 百度学术
10. 吕江艳,龙鹏宇,罗维钢,李伏生,农梦玲. 甘蔗节水高产和蔗田氧化亚氮减排的滴灌施肥模式. 节水灌溉. 2023(12): 1-8 . 百度学术
11. 关追追,卢奇锋,陈动,邱权,苏艳,李吉跃,何茜. 施肥方式对幼龄楸树非结构性碳器官分配和生长季动态的影响. 西北植物学报. 2022(08): 1355-1362 . 百度学术
其他类型引用(11)