
Mathematical model analyses of laying curves for layer breeders in natural mating cages
-
摘要:目的
筛选适合四层层叠本交笼鸡舍种鸡的最佳产蛋曲线数学模型。
方法所有试验鸡均饲喂于全封闭式鸡舍四层层叠式本交笼,采集19~61周龄的海兰褐父母代种鸡的产蛋记录,运用伍德模型、McMillan模型和杨宁模型拟合种鸡产蛋率,并比对分析3种模型的拟合效果。
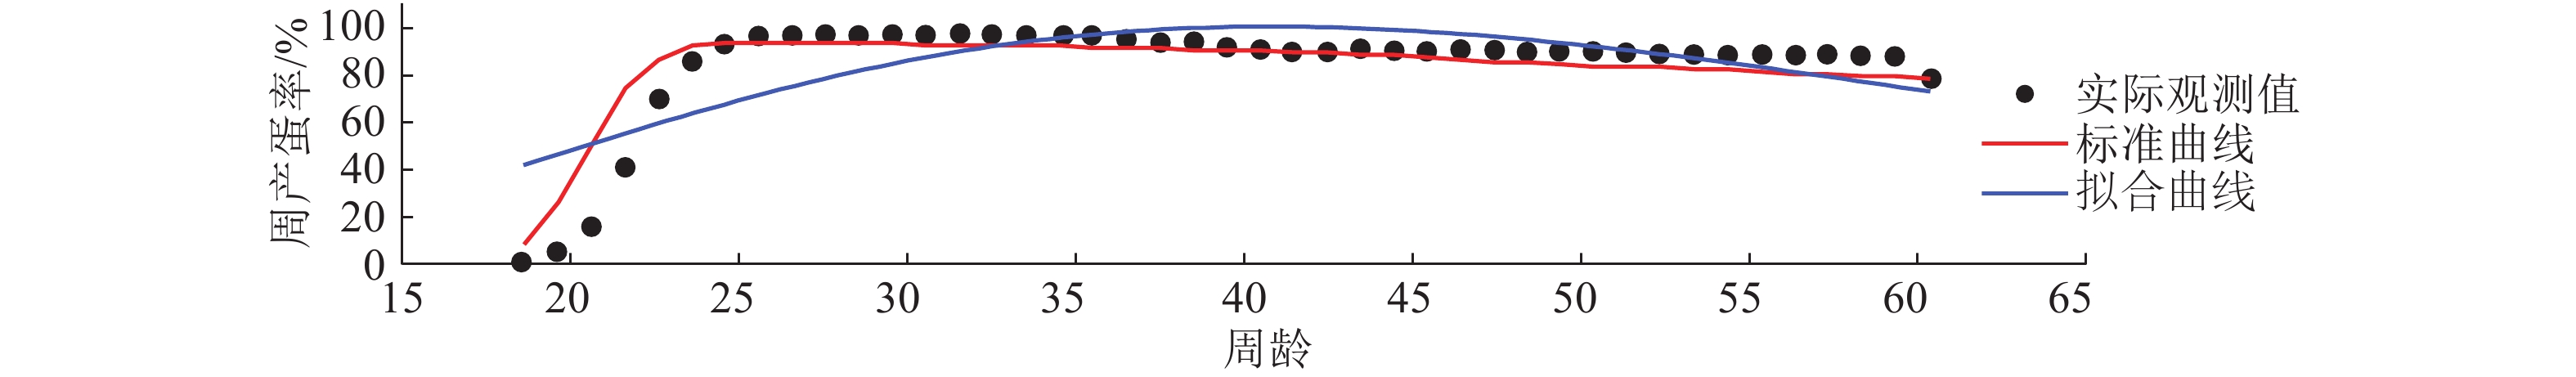
结果3种模型均可用于产蛋率拟合,杨宁模型、McMillan模型和伍德模型R值分别为0.997 87、0.964 63和0.764 57,说明杨宁模型的拟合效果最好,McMillan模型次之,伍德模型最差。杨宁模型更适合实际观测数据,适合程度约为McMillan模型的1.160 37×1026倍,为伍德模型的1.599 31×1042倍。不同生产阶段的产蛋率呈不同特征,与海兰褐标准产蛋率相比,种鸡在产蛋率上升阶段的实际观测值低于相同周龄的标准值。
结论杨宁模型最适合四层层叠本交笼鸡舍种鸡产蛋率拟合,生产过程中要根据模型和产蛋曲线特征科学合理地饲养管理,以达到生产效益最优化。
Abstract:ObjectiveTo screen the best mathematical model of laying curves for layer breeders in layer breeder houses installed natural mating cages with four overlap tiers.
MethodAll the experimental Hy-Line Brown parent stock layers were fed in the closed layer breeder houses installed natural mating cages with four overlap tiers, and laying records from the 19th to 61th week were collected. The laying rates were fitted using Wood model, McMillan model and Yangning model respectively, and their fitting effects were compared.
ResultAll three mathematical models were available for laying rate fitting. The R values of Yangning model, McMillan model and Wood model were 0.997 87, 0.964 63 and 0.764 57 respectively, which showed that Yangning model was the best, followed by McMillan model and Wood model successively. Yangning model was more suitable for actually observed data, and the suitability degree was 1.160 37×1026 times of McMillan model, 1.599 31×1042 times of Wood model. The laying rate curves showed different characteristics in different periods. Compared with the standard laying rates of Hy-Line Brown stock layers in the same age, the experimental laying rates of layer breeders during early rising stage were lower.
ConclusionYangning model is most suitable for laying rate fitting of layer breeders in layer breeder houses installed natural mating cages with four overlap tiers. The feeding management should be carried out scientifically and reasonably according to fitting model and egg production curve to maximize the benefits in production process.
-
Keywords:
- layer breeder /
- natural mating cage /
- laying curve /
- mathematical model /
- fitting effect
-
水稻Oryza sativa L.是世界上超过一半人口的主要粮食作物,深入挖掘重要的功能基因对水稻主要农艺性状的遗传改良具有重要意义。高密度遗传图谱的构建为基因的精准定位和克隆创造了必要条件。
本研究使用的重组自交系(Recombinant inbred lines,RILs)群体是由籼稻‘MDS’和籼稻‘R315’构建的高代重组自交系,具有稳定的表型性状,是一个良好的永久性遗传群体。自1988年McCouch等[1]利用籼稻‘IR34583’与爪哇稻‘Bulu Dalam’衍生的F2群体构建了第1张含135个限制性内切酶片段长度多态性(Restriction fragment length polymorphism,RFLP)标记的水稻分子连锁图谱以来,水稻的遗传图谱相继诞生。传统的图谱构建通常利用RFLP、简单重复序列(Simple sequence repeat,SSR)标记和随机扩增多态性DNA(Random amplified polymorphic DNA,RAPD)标记。结合多种分子标记技术进行遗传图谱构建可进一步增加标记的密度。徐建龙等[2]利用272个均匀分布的标记(141个RFLP标记、99个SSR标记、29个RAPD标记和3个形态标记)构建了连锁图用于QTL分析,该连锁图总共覆盖基因组2 777.7 cM,相邻标记间平均距离为10.2 cM。早期的分子标记,作图距离通常较大,后期精细定位工作需要大量分离的F2代个体。随着DNA测序技术的快速发展,基于高通量测序的新型分子标记越来越多地应用于高密度遗传图谱的构建[3-4]。Chen等[5]利用148个子代组成的RIL群体构建了1 680.9 cM的遗传图谱,平均遗传距离为1.16 cM,共定位到23个耐盐相关QTLs,其中,位于第1、4、12号染色体上的3个QTLs表现出累加效应。单核苷酸多态性(Single nucleotide polymorphism,SNP)标记作为第3代新型分子标记技术,具有数量多、遗传稳定性高以及易于自动化分析等优点[6],已成为近年来水稻高密度遗传图谱构建的优先选择。
本研究利用全基因组测序(Whole genome sequencing,WGS)技术对籼稻‘MDS’和籼稻‘R315’构建的1个RIL群体进行全基因组测序,先鉴定出两亲本间的SNP,再利用SNP构建bin标记,最后构建1张高密度遗传图谱,以期为进一步深入挖掘和研究重要农艺性状基因奠定有利基础。
1. 材料与方法
1.1 试验材料
本研究使用的材料为国家植物航天育种工程技术研究中心前期收集的籼稻地方品种‘MDS’和‘R315’。父本‘MDS’是大穗、抗倒、高产型的地方籼稻品种,具有高光效、高养分利用率等特点。母本‘R315’是在‘象牙香占’基础上改良的籼稻恢复系,具有抗病、优质、配合力好等特点,父母本杂交,F2代通过单粒传法繁殖获得高世代RILs。
1.2 CTAB法提取植物叶片DNA
2019年晚季在华南农业大学校内教学科研试验基地的试验田中种植水稻亲本和RILs群体(含192个株系),每个材料按6行×6株的规模种成小区,株行距均为20 cm,单苗插植,常规栽培管理。F5代单株收种。亲本及其RILs(F6代)群体取20粒饱满种子萌发,取各个株系的幼嫩叶片(每个株系随机取5株混样),按CTAB法[7]提取DNA后送至北京诺禾致源生物信息科技有限公司进行测序分析。
1.3 DNA文库构建及测序
检测合格的DNA样品通过酶切、加测序接头、纯化、PCR扩增等步骤完成整个文库制备。构建好的文库通过Illumina(测序仪)进行测序。
1.4 测序数据质量评估及分析
检测合格的DNA文库进行HiSeq测序,产出Raw reads,结果以fastq文件格式存储。经过过滤,得到高质量的Clean reads。对192个子代及亲本测序数据进行统计,包括测序reads数量、数据产量、测序错误率、Q20、Q30、GC含量等。另外,将Clean data与NCBI的核苷酸数据库进行比对,以评估是否有其他来源的DNA污染。将2个亲本及192个子代测序数据与参考基因组( http://www.mbkbase.org/R498/)进行比对,反映测序数据与参考基因组的相似性,覆盖深度和覆盖度能够反映测序数据的均一性及与参考序列的相似性。
1.5 单核苷酸多态性检测与标记开发
SNP主要是指在基因组水平上由单个核苷酸的变异所引起的DNA序列多态性,包含单个碱基的转换、颠换等。基于Burrows-Wheeler aligner (BWA)比对结果,利用群体检测SNP的方式对亲本和192个子代进行SNP检测。对BWA比对结果进行过滤:将比对到水稻参考基因组上唯一位置的reads挑选出来,采用GATK(The genome analysis toolkit)[8]对过滤后的bam文件进行群体SNP的检测。为减少测序错误造成的假阳性SNP,要求亲本SNP碱基支持数不少于5,子代SNP碱基支持数不少于3,统计杂合SNP数、纯合SNP数和杂合SNP比例(杂合SNP数/总SNP数)。
基于亲本基因型检测结果,进行亲本间多态性标记开发,并选择RIL群体的可用标记类型(“aa×bb”型),即2个亲本的某个SNP基因型都为纯合且不相同。完成标记开发后,提取192个子代在亲本多态性标记位点的基因型,对分型后的标记进行筛选。首先进行异常碱基检查,子代分型结果中,可能会出现少数亲本中没有出现的碱基型,则认为该碱基是异常碱基,碱基缺失用“—”表示;基于上述结果继续进行异常基因型检查,本研究群体类型为RILs,在子代分离群体中,主要以纯合为主,杂合类型占比很低,杂合标记也视为异常基因型,转化为缺失。
1.6 高密度图谱构建及质量评估
利用最终获得的高质量SNP标记,对每个个体使用15个SNP滑动窗口、步移长度为1的策略检测RILs间的重组断点,得到群体重组断点分布图。针对每个连锁群使用JoinMap4.0对每个连锁群的bin标记进行排序(连锁群使用回归算法排序,采用Kosambi函数计算遗传距离)。根据获得的bin标记的遗传距离,使用perl SVG模块绘制连锁图,并依据文献[9]对标记在基因组上的位置和遗传图谱进行共线性分析。
2. 结果与分析
2.1 亲本性状差异及测序数据信息分析
通过对两亲本的农艺性状数据进行差异显著性分析,发现两亲本在每穗颖花数、粒长、每穗实粒数、叶宽、株高和二级枝梗数上具有极显著差异(P<0.01)(图1),每穗颖花数、粒长、每穗实粒数、叶宽、株高、二级枝梗数是后续研究重点关注性状。
![]() 图 1 亲本农艺性状分析“**”表示亲本间差异极显著(P<0.01,t检验)Figure 1. Agronomic character analysis between parents“**” indicates highly significant difference between parents (P < 0.01, t test)
图 1 亲本农艺性状分析“**”表示亲本间差异极显著(P<0.01,t检验)Figure 1. Agronomic character analysis between parents“**” indicates highly significant difference between parents (P < 0.01, t test)通过对两亲本和RILs群体192个子代检测合格的DNA文库进行HiSeq测序,总共获得549 496 399 500 bp测序量。亲本‘MDS’得到4 140 981 000 bp Raw reads,过滤后得到Clean reads 4 134 873 600 bp,平均测序深度为9.33×;亲本‘R315’ 共得到4 395 794 100 bp Raw reads,过滤后得到4 390 405 500 bp Clean reads,平均测序深度9.66×。RILs群体192个子代中平均每个个体的Raw reads 约2 817 557 919 bp,平均测序深度6.33×。亲本总体测序质量高,Q20≥95%,Q30≥89%,GC分布正常,‘MDS’和‘R315’中GC含量分别为43.73%和44.12%。
将2个亲本及192个子代的测序数据与参考基因组比对。参考基因组大小为390 983 850 bp,192个子代样本比对率均在91%以上,1×覆盖度(至少有1个碱基的覆盖)平均为92.45%,对参考基因组捕获区域的平均覆盖深度为6.30×;比对结果可用于后续的变异检测及相关分析。
2.2 SNP识别与基因分型
基于2个亲本的基因型分析结果,开发的标记类型及数量如图2所示,父母亲本间共鉴定出具有多态性的位点470 833个,可用标记类型为“aa×bb”型,共计221 494个。
![]() 图 2 开发的单核苷酸多态性标记的类型及数量“a”、“b”代表不同的碱基类型Figure 2. Type and quantity of developed single nucleotide polymorphism markers“a” and “b” represent different base types
图 2 开发的单核苷酸多态性标记的类型及数量“a”、“b”代表不同的碱基类型Figure 2. Type and quantity of developed single nucleotide polymorphism markers“a” and “b” represent different base types对分型后的遗传标记进行筛选,未发现异常碱基,说明基因分型准确性较好。基于筛选的结果对子代分型结果进行异常基因型检查,未发现杂合类型,说明RILs子代群体中,杂合类型占比较低。最终获得221 494个有效标记用于连锁性分析。
2.3 高密度遗传图谱构建及质量评估
基于获得的221 494个SNP标记,对每个个体使用15个SNP滑动窗口、步移长度为1的策略[9]检测RILs间的重组断点,得到群体重组断点图(图3)。利用图2的标记信息,可追踪到192个子代中每个子代的每条染色体的重组事件发生的位置。
![]() 图 3 群体重组断点图Chr 1~12:染色体编号;红色表示与亲本‘R315’一致的区域,蓝色表示与亲本‘MDS’一致的区域Figure 3. Group recombination breakpoint diagramChr 1−12: Chromosome number; Red area is consistent with parent ‘R315’, blue area is consistent with parent ‘MDS’
图 3 群体重组断点图Chr 1~12:染色体编号;红色表示与亲本‘R315’一致的区域,蓝色表示与亲本‘MDS’一致的区域Figure 3. Group recombination breakpoint diagramChr 1−12: Chromosome number; Red area is consistent with parent ‘R315’, blue area is consistent with parent ‘MDS’使用JoinMap4.0对每个连锁群的bin标记进行排序(连锁群使用回归算法排序,使用Kosambi函数计算遗传距离),最终获得bin标记1 612个,均匀分布在各染色体上(图4)。用perl SVG模块绘制连锁图,总图距1 327.82 cM,覆盖了12个连锁群(分布在水稻的12条染色体上),标记间的平均图距为0.82 cM。各个连锁群bin标记数量、总图距、平均图距等基本信息如表1所示。其中第1号染色体(Chr 1)连锁群图距最长,为170.19 cM,包含bin标记最多,为194个,标记间平均图距是0.88 cM;第11号染色体(Chr 11)连锁群图距最短,为60.18 cM,包含bin标记最少,为68个,标记间的平均图距是0.89 cM;连锁群中最大间隔(Maximum gap)长度小于5 cM的比例高达98.2%。
表 1 遗传连锁群信息Table 1. Characteristics of genetic linkage group染色体编号
Chromosome number标记数量
Marker number总图距/cM
Total map distance平均图距/cM
Average map distance最大间隔/cM
Maximum gap1 194 170.19 0.88 9.73 2 137 100.75 0.74 5.39 3 164 139.83 0.85 18.29 4 174 125.12 0.72 18.53 5 144 114.72 0.80 14.73 6 125 114.46 0.92 7.75 7 151 128.06 0.85 11.96 8 132 113.11 0.86 19.60 9 116 94.48 0.81 7.68 10 95 68.13 0.72 5.23 11 68 60.18 0.89 5.24 12 112 98.79 0.88 6.07 合计 Total 1 612 1 327.82 0.82 19.60 ![]() 图 4 连锁群标记分布图Chr 1~12:染色体编号;图上横线表示标记位置Figure 4. Distribution map of linkage group markerChr 1−12: Chromosome number; The horizontal line on the map indicates marker location
图 4 连锁群标记分布图Chr 1~12:染色体编号;图上横线表示标记位置Figure 4. Distribution map of linkage group markerChr 1−12: Chromosome number; The horizontal line on the map indicates marker location共线性分析结果(图5)显示,各个连锁群上大部分标记与在基因组上保持一致,共线性较好,图谱质量高。
![]() 图 5 遗传图谱和物理图谱的共线性分析左侧刻度为相对遗传距离;Chr 1~12:染色体编号;Lg 1~12:连锁群编号;红色为连锁群,蓝色为参考基因组R498染色体Figure 5. Collinearity analysis between genetic map and physical mapThe left scale is relative genetic distance; Chr 1−12: Chromosome number; Lg 1−12: Linkage group number; Red area is linkage group and blue area is chromosome of reference genome R498
图 5 遗传图谱和物理图谱的共线性分析左侧刻度为相对遗传距离;Chr 1~12:染色体编号;Lg 1~12:连锁群编号;红色为连锁群,蓝色为参考基因组R498染色体Figure 5. Collinearity analysis between genetic map and physical mapThe left scale is relative genetic distance; Chr 1−12: Chromosome number; Lg 1−12: Linkage group number; Red area is linkage group and blue area is chromosome of reference genome R4983. 讨论与结论
高通量测序技术的迅速发展加速了水稻重要基因的挖掘和应用,在育种上也可以应用相关分子标记提高材料选育的准确性,加快品种选育。运用高通量测序获得高质量SNPs并构建遗传图谱进行QTL鉴定是目前的研究热点。
亲本的选择是获得高质量图谱的第一步,对后续的QTL定位也至关重要。亲本间的DNA具有多态性是选材的首要条件,在某一表型或者多个表型具有极端差异的2个材料是理想的选择。在研究产量[10-12]、粒形[13-14]等性状时,亲本的目的性状要存在极端差异。前期观察分析发现籼稻‘MDS’和‘R315’在多个农艺性状上均存在明显差异,包括株高、叶色、叶长、叶宽、粒形、穗粒数等。进一步的分析发现双亲在每穗粒数、叶宽、每穗实粒数、粒长、二次枝梗数、株高等性状上均存在极显著差异,预示着双亲中可能存在多个控制水稻产量的基因或者QTLs。接下来我们将对群体的多个表型数据进行分析,结合构建的高密度遗传图谱开展深入的研究。
基于重测序获得高质量的SNPs,再划分bin标记能大幅度提高作图的精度与效率,Huang等[9]对150个子代的RIL群体在F8代使用287个分子标记进行基因分型,构建的遗传图谱标记间平均遗传距离为5 cM,平均物理距离为1.4 Mb,需要3个人通过1年的工作完成;而在F11代使用重测序,每40 kb就获得1个SNP,将重组断点的分辨率提高了35倍,仅花费2周时间,将每15个SNPs划分为1个bin标记,标记间平均遗传距离为2.3 cM,平均物理距离为600 kb。本研究在前人基础上构建的图谱标记间平均遗传距离为0.82 cM,平均物理距离为242 kb,平均每16 kb就能产生1个SNP,进一步提高了重组断点的分辨率。
标记的数量也是遗传图谱的一个重要指标,籼粳杂交能获得丰富的多态性位点[1],但会定位到大量的QTLs,使得后续的研究难以进行。所以进一步精细定位高级的作图群体,主要指近等基因系类群体,其通过连续重复回交获得,特征是群体中个体间遗传背景相似,仅带有少数供体片断,从而消除背景的干扰和主效基因对微效QTLs的掩盖作用,如导入系(Introgression lines,ILs)和替换系(Substitution lines,SLs)[15-16],其目的为在保证遗传背景更加相似的情况下得到准确的结果。本研究选择了在表型上具有较大差异的2个籼稻品种作为亲本,以期在去除相同的遗传背景后得到一定的多态性遗传标记,准确关联到差异表型的QTLs。
QTL及基因鉴定的终极目的是应用于育种。针对水稻的重要性状,当前已经定位和克隆了一些重要基因,但大部分的QTLs或基因都只停留在试验阶段,没能与育种实践结合起来。其中主要的1个原因就是部分QTLs受遗传背景影响很大,很难在不同群体中检测到相同的QTL位点,这很可能是因为QTL的上位性占据了主导地位[17]。主效QTL或基因的定位,通常会选择遗传背景有较大差异的亲本构建群体,例如常用的籼粳杂交群体,对于群体中发现的有价值的QTL想用于选育出好的品种进行推广,还需要进行多次回交、自交,严重影响育种进程。与此同时,得到的结果会因为材料或者鉴定的环境改变而无法在育种中展开,最终导致定位到的QTL或基因与育种实践相脱节[18-19]。本研究选择的2个籼稻品种,在遗传背景相对相似的情况下,获得的QTL或基因能更加稳定地表达,而且选择双亲时要注重在性状上互补,在高世代的RILs群体中才可以直接筛选到能稳定遗传的目标株系用于水稻品种选育,从而达到使QTL鉴定与育种同步进行、互相验证的目的。
-
![]()
图 1 伍德模型的产蛋率拟合曲线和标准曲线比较
Figure 1. Comparison of the laying rate fitting curve of Wood model with the standard curve
表 1 3种模型拟合效果分析和参数估计
Table 1 The fitting effect analyses and parameter estimations of three models
模型 拟合效果分析 参数估计值1) P R a b c d 伍德模型 0 0.764 57 0.000 04 3.718 14 0.089 96 McMillan模型 0 0.964 63 1.227 28 0.006 65 0.268 61 19.474 91 杨宁模型 0 0.997 87 1.063 45 0.003 83 1.210 20 22.339 65 1) a:最大潜在产蛋率,b:产蛋率下降参数,c:产蛋率上升参数,d:开产周龄  下载: 导出CSV
表 2 3种模型产蛋率拟合结果比对1)
Table 2 Comparisons of laying rate fitting effects of three models
模型比对 模型 F P 赤池信息量准则值(AIC值) 赤池权重值 比对1 伍德模型 194.172 81 1.110 22×10–16 –156.739 29 7.255 43×10–17 McMillan模型 –231.063 68 1 比对2 伍德模型 3 762.760 01 0 –156.739 29 6.252 69×10–43 杨宁模型 –351.095 58 1 比对3 McMillan模型 — — –231.063 68 8.617 95×10–27 杨宁模型 –351.095 58 1 1) “—”表示F检验失效,未得到确定值
下载: 导出CSV
-
[1] WOOD P D P. Algebraic model of the lactation curve in cattle[J]. Nature, 1967, 216(5111): 164-165.
[2] McMILLAN I, FITZ-EARLE M, BUTLER L, et al. Quantitative genetics of fertility: II. Lifetime egg production of Drosophila melanogaster: Experimental[J]. Genetics, 1970, 65(2): 355-369.
[3] McMILLAN I A N. Compartmental model analysis of poultry egg production curves[J]. Poult Sci, 1981, 60(7): 1549-1551.
[4] YANG N, WU C, McMILLAN I A N. New mathematical model of poultry egg production[J]. Poult Sci, 1989, 68(4): 476-481.
[5] McNALLY D H. Mathematical model for poultry egg production[J]. Biometrics, 1971, 27(3): 735-738.
[6] GAVORA J S, PARKER R J, McMILLAN I. Mathematical model of egg production[J]. Poult Sci, 1971, 50(5): 1306-1315.
[7] 李俊营, 詹凯, 刘伟, 等. 笼养淮南麻黄鸡产蛋曲线的数学模型研究[J]. 福建农业学报, 2013, 28(12): 1204-1207. [8] 蒋松, 肖礼华, 张龙, 等. 二郎山山地鸡SD02和SD03品系一世代产蛋率曲线比较分析[J]. 黑龙江畜牧兽医(科技版), 2012(7): 1-3. [9] 田亚东, 商鹏飞, 焦显芹, 等. 淅川乌骨鸡生长和产蛋曲线的数学模型分析[J]. 河南农业大学学报, 2014, 48(4): 440-444. [10] 冯敏山, 高山林, 杨增芳, 等. AA 父母代肉鸡产蛋曲线的数学模型分析[J]. 中国家禽学报, 2003, 7(1): 20-21. [11] 刘天飞, 瞿浩, 马杰, 等. 商业化模式下的优质肉鸡产蛋曲线数学模型研究[J]. 四川农业大学学报, 2012, 30(1): 110-113. [12] 章元明, 田有庆. 四川白鹅产蛋数学模型的研究[J]. 西南农业大学学报, 1995, 17(6): 550-552. [13] 顾玉萍, 侯启瑞, 王金玉, 等. 京海黄鸡生长和产蛋率曲线的拟合[J]. 中国家禽, 2010, 32(20): 26-29. [14] 骆磊, 张龙, 黄钦柯, 等. 地方蛋鸡新品系(HS)基础群产蛋率与累计产蛋数曲线拟合[J]. 四川农业大学学报, 2013, 31(4): 438-443. [15] 吕敏芝, 罗良豪, 冯莹莹, 等. 仙湖鸭产蛋曲线数学模型研究[J]. 中国家禽, 2014, 36(10): 6-8. -
期刊类型引用(5)
1. 刘进,周慧颖,马小定,孟冰欣,崔迪,胡佳晓,涂夯,余丽琴,韩龙植,黎毛毛. 基于高密度遗传图谱定位水稻抽穗期耐热性QTL. 植物遗传资源学报. 2025(05): 962-973 .  百度学术
百度学术
2. 赵凌,张勇,魏晓东,梁文化,赵春芳,周丽慧,姚姝,王才林,张亚东. 利用高密度Bin图谱定位水稻抽穗期剑叶叶绿素含量QTL. 中国农业科学. 2022(05): 825-836 . 百度学术
3. 宋博文,王朝欢,赵哲,陈淳,黄明,陈伟雄,梁克勤,肖武名. 基于高密度遗传图谱对水稻粒形QTL定位及分析. 作物学报. 2022(11): 2813-2829 . 百度学术
4. 潘俊峰,崔克辉,刘彦卓,王昕钰,严博宇,梁开明. 利用高密度Bin图谱定位水稻叶绿素含量QTL. 广东农业科学. 2022(09): 132-140 . 百度学术
5. 刘进,胡佳晓,马小定,陈武,勒思,Jo Sumin,崔迪,周慧颖,张立娜,Shin Dongjin,黎毛毛,韩龙植,余丽琴. 水稻RIL群体高密度遗传图谱的构建及苗期耐热性QTL定位. 中国农业科学. 2022(22): 4327-4341 . 百度学术
其他类型引用(11)


计量
- 文章访问数: 1362
- HTML全文浏览量: 6
- PDF下载量: 1510
- 被引次数: 16
